Ask a room of coaches whether they would rather have the best attack in the league or the best defence, and most of them pick attack. It is more fun to coach, more fun to watch, and it is what players ask for. We took thousands of fully analysed matches spanning every variety of rugby, men’s and women’s, from amateurs to professionals, scored each team’s attack and defence separately, and checked which one actually tracks the result. Defence separates winners from losers far more sharply than attack does.
Winning collisions helps. Completing tackles helps much more.
We used two measures that are as close to like-for-like as this data allows. For attack, the share of collisions the ball carrier won. For defence, the share of tackle attempts that were completed. Both are rates rather than volumes, so neither rewards a team simply for having the ball more.
Sort every match into quarters by how well the team attacked, and the win rate climbs from about four in ten in the worst quarter to roughly two in three in the best. A real effect, and worth having. Now sort the same matches by how well they defended, and the win rate climbs from about a third to just over seven in ten. The gap between the worst and best defensive quarter is more than half again as wide as the attacking one.
Good attack with poor defence is a coin flip
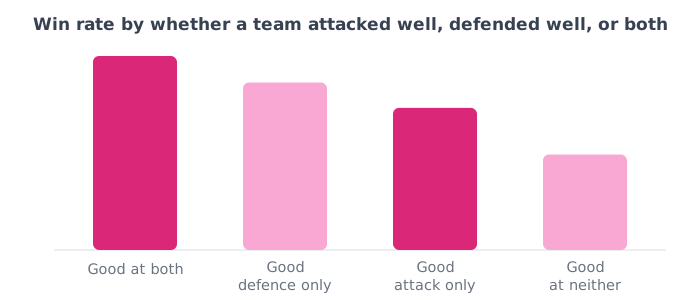
The cleanest way to see it is to split teams on both measures at once. Teams above average at attacking and defending won getting on for seven in ten. Teams below average at both won about a third. No surprises there.
The interesting pairs are the lopsided ones. A team with good attack and poor defence won barely more than half its matches, which is to say it may as well have tossed a coin. A team with poor attack and good defence won closer to six in ten. Given the choice between fixing one and living with the other, the numbers say fix the defence.
The trap: tackling a lot is not the same as tackling well
There is an obvious objection, and checking it changes how you read all of this. If defence is so decisive, does simply making more tackles help?
It does the opposite. Teams in the top quarter for tackle attempts won noticeably fewer matches than those in the bottom quarter. That reads as nonsense until you remember why a team makes a lot of tackles: because the other side has the ball. Tackle volume is mostly a measure of not having possession, which is why it points the wrong way.
Tackle completion is different. It is a rate, so it does not care how much defending you had to do, only how well you did it. That distinction is the whole finding. The teams that win are not the ones that tackle most. They are the ones that miss least.
What to do with this
If you have one block of contact work a week, spend it on tackle technique rather than carry dominance. The ceiling on attacking improvement is real but lower, and the floor on defensive improvement is where matches are actually lost.
It also changes what you look at on a Monday. A team that lost while carrying well has a defensive problem, not an attacking one, and the tape you pull should reflect that. What a good tackle completion rate looks like is the companion number to this one.
How we worked this out
Based on thousands of fully analysed matches spanning every variety of rugby, men’s and women’s, from amateurs to professionals, deduplicated so no fixture is counted twice. We required a minimum number of carries and tackle attempts per match before including it, so a thin recording cannot produce an extreme rate on a handful of events. Results came from reconstructing each side’s score from its scoring events, and drawn matches were excluded rather than counted as half a win, because a derived scoreline is not precise enough at the level of a single match to trust a dead heat. One honest caveat: carries and tackles are recorded for the analysed team, which is the side of the game our data captures most completely, so this compares each team against the field rather than head to head within a fixture. That should if anything understate the effect, since it adds noise rather than direction. The check that this is measuring something real is that the two rates are recorded independently of each other, and the volume test above points the opposite way to the completion test, which is exactly what you would expect if one is a possession artifact and the other is a skill.
Hero photo: Jack86mkII, CC BY-SA 4.0, via Wikimedia Commons.