The usual answer is the openside, who competes for the ball at nearly every breakdown. The data says that is right, but only just, and the raw count hides a more useful answer. We collected every penalty by the shirt number of the player who gave it away, across thousands of matches from every variety of rugby, men’s and women’s, from amateurs to professionals. The 7 and the loosehead are level at the top, the forwards give away about two in three, and once you allow for how often each player is involved, the props are the most penalised shirts on the pitch.
The 7 and the 1 lead, and the pack sits close behind
A team gives away about a dozen penalties a match. The number 7 and the number 1 each concede nearly one of them, about one in eleven of all the penalties the starters give away, and the gap between them is too small to call: they swapped places when we split the matches at random. The 8 and the hooker follow, then the tighthead, the locks and the blindside.
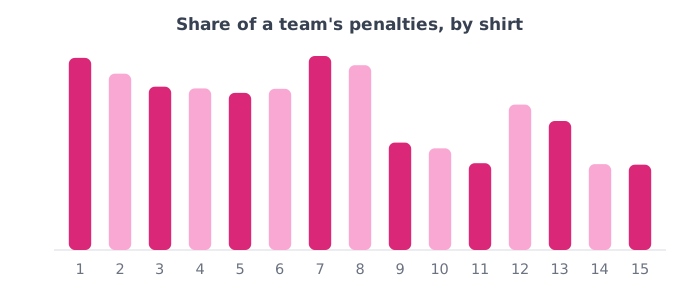
The eight forwards concede about two penalties in every three. The front row and the back row take about a quarter each, and the two locks about one in seven between them.
The back three give away less than half as many
The 12 is the most penalised back, a little under the locks, and the 13 is next. Scrum-half and fly-half are lower again, even though they touch the ball more than anybody. The wings and the full-back concede less than half as many as the 7, at around one penalty every two or three matches each.
That is mostly geography. Most penalties come at the ruck, and the back three spend less of the match near one.
Per involvement, the front row concedes most
A raw count rewards players who are simply busy, so we divided each shirt’s penalties by its involvements: carries, tackles, ruck arrivals and passes. That turns the table over. The 7 drops back into the pack. The loosehead gives away a penalty about every 22 involvements, the tighthead and the hooker about every 27, and most other shirts about every 33. The 9, who passes constantly, concedes one about every 110.
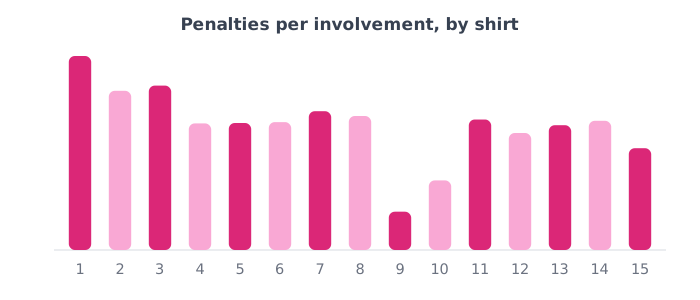
Part of the reason is the scrum, which adds penalties without adding anything to that count. Looking at what happened in the seconds before each penalty, about a third of the loosehead’s come around a scrum, against about one in twenty for a lock. Across the whole team, about six penalties in ten come around a ruck, about one in six around a scrum and about one in seven around a lineout.
What to do with this
Fix penalties where they happen, and by position. For your back row and locks, that means ruck entry and roll-away work. For your front row, it is scrum time with someone who knows what the referee is looking at, because a third of a loosehead’s penalties will not be fixed at a breakdown drill. Your 12 concedes more than any other back, so give them the same tackle-height and roll-away reps as a flanker.
Do not treat a high count as a bad player. The 7 is high partly because the 7 is everywhere, so compare a player’s total with how involved they are before you say anything. For what each penalty costs on the scoreboard, see what indiscipline costs you and whether more penalties lose you the game. Seeing this for your own squad takes a record of every penalty by player, which is what analysis software is for.
How we worked this out
Based on tens of thousands of penalties across thousands of fully analysed full-length matches spanning every variety of rugby, men’s and women’s, from amateurs to professionals, deduplicated so no fixture is counted twice. Each penalty conceded is recorded against the shirt number of the player who gave it away, and we used the shirt as a stand-in for position, which is fair where teams number their starting fifteen in the usual way. Penalties where the number could not be read are excluded, and so are shirts above fifteen, about one in six, because replacement shirts do not map reliably onto positions. To check the order, we split the matches at random three times: the 7, 1, 8 and 2 filled the top four every time, and they led in senior men’s and women’s rugby separately, with the 8 narrowly first in the women’s game. Penalties are not recorded by type, so the scrum, lineout and ruck shares come from the events in the fifteen seconds before each penalty. That is a fair guide and not a referee’s explanation. One caveat: some teams number their squads their own way, so the positions are approximate. Player-level penalties are recorded for the team being analysed, the side of the game our data captures most completely.
Hero photo: Henning Schlottmann (User:H-stt), CC BY-SA 4.0, via Wikimedia Commons.