“Cut out the penalties” is the most common instruction in rugby, and we have already looked at who gives them away. This time we asked the question underneath the instruction: does the team that gives away more penalties than the opposition lose the match? We compared both teams’ penalty counts in thousands of matches from every variety of rugby, men’s and women’s, from amateurs to professionals. Over a whole match, the penalty count barely separates winners from losers. What a penalty costs is paid in the next two minutes.
In a close game, winners and losers give away the same number
Take the matches that finished within one score, the games where discipline ought to decide things. The winners and the losers gave away the same number of penalties on average, and the side that conceded fewer won barely more often than the side that conceded more.
Across all matches, the team that conceded more penalties won more often than the team that conceded fewer, and the reason is when those penalties were given away.
The first-half count tells you nothing, and the second half runs backwards
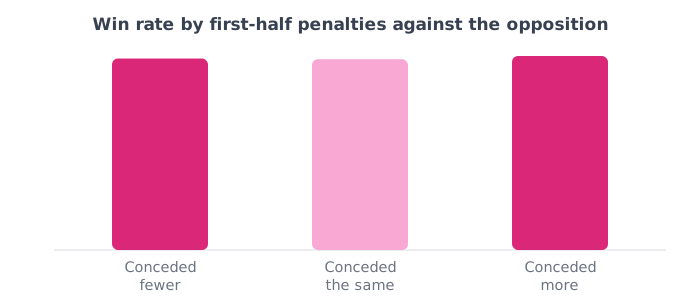
Split each match at half time. In the first half, the side that conceded more penalties won just as often as the side that conceded fewer, a little over half the time either way. In the second half the link turns around: the side that conceded more went on to win more than three times in five, and the side that conceded fewer won under half the time.
The second-half pattern is the scoreboard at work. A team in front has less of the ball, a little under half the rucks while it leads against a little over half while it trails, so it spends more time defending, and defending is where most penalties are given away. A team in front concedes penalties about a third more often than a team behind. The lead comes first, and the penalties follow it.
A penalty’s cost comes due in the next two minutes
None of that makes penalties free. In an ordinary two-minute spell of a match, a team scores about one time in eight. In the two minutes after the other side gives away a penalty, it scores about one time in four, and it scores a try about one time in five, more than double the usual rate. Very little of that is advantage being played: only a small share of those scores come within twenty seconds of the penalty, and more than half arrive after the first minute, about the time it takes to kick to touch and set a lineout.
What to do with this
Stop judging discipline by the match total. A side that is winning comfortably will pile up a few late penalties and a side that is chasing will not, so the total is partly a measure of who had the ball. What matters is the penalty itself and the two minutes after it. Put the two halves of this together and the penalty to worry about most is the one conceded while defending a one-score lead late on, which is also when a narrow lead is at its most fragile.
Seeing your own penalties laid out against the scoreboard, match by match, needs every match recorded with its timings. That is quicker to set up than most teams expect: your first week with rugby analysis software.
How we worked this out
Based on penalties recorded for both teams across thousands of fully analysed full-length matches spanning every variety of rugby, men’s and women’s, from amateurs to professionals, deduplicated so no fixture is counted twice. Both sides’ penalties are recorded in every match, so each game gives a direct comparison of who conceded more. We rebuilt each scoreline from tries, conversions, penalties and drop goals, found half time from the natural break in the recorded events, and left out matches that finished level. As a check that both teams’ penalties are recorded consistently, we compared each side’s count with the other side’s kicks at goal: the two rise together, and by about the same amount for either team. The two-minute figures compare the window after every penalty with evenly spaced windows through each match. One honest caveat: we can see when a penalty happened but not where on the field, so this cannot separate a penalty on halfway from one under your own posts. Analysed teams are often the stronger side, but every comparison here is between the two teams in the same match.
Hero photo: Jean-Jacques Chollon, CC BY-SA 4.0, via Wikimedia Commons.