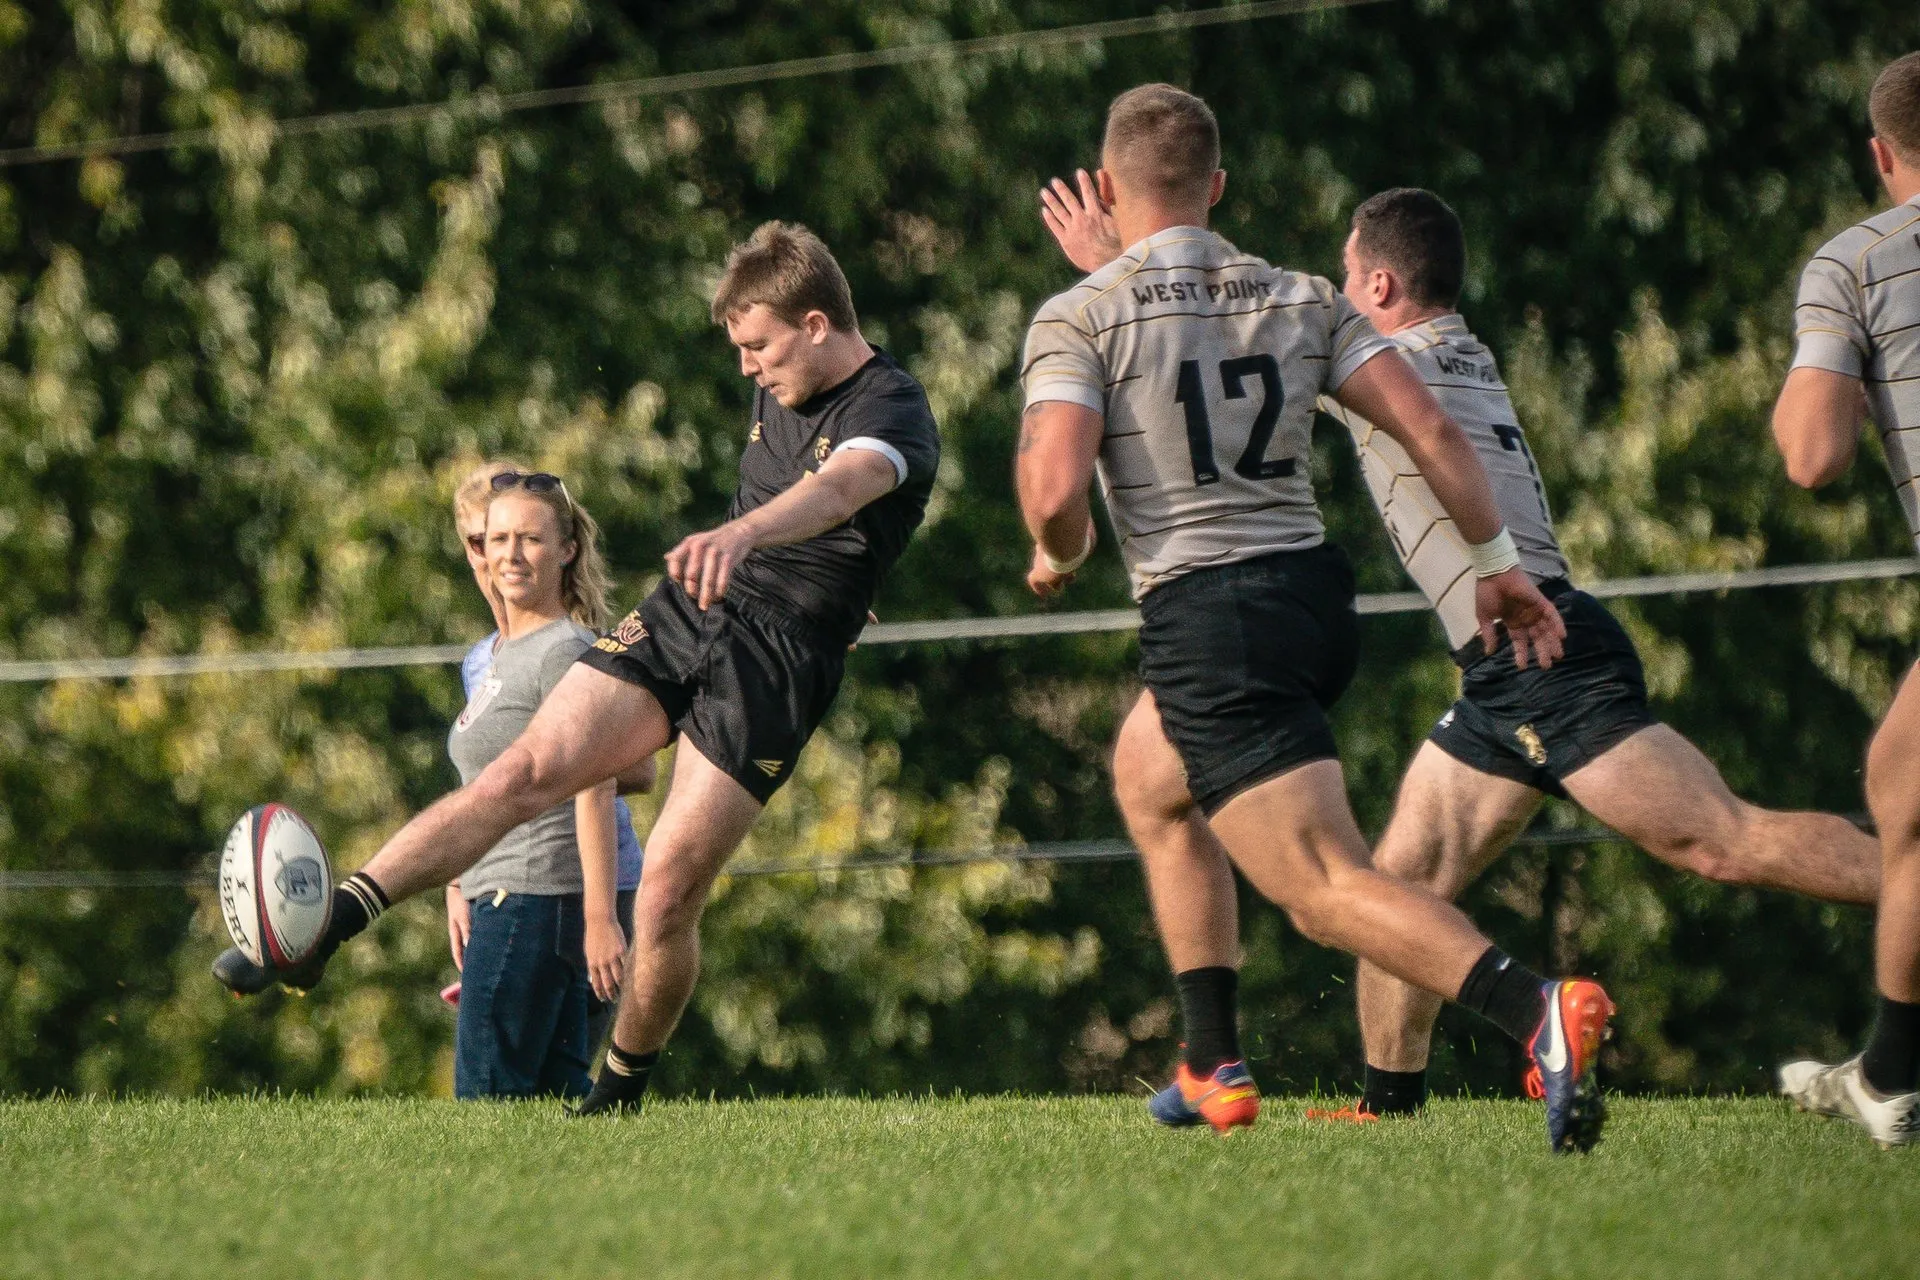
Kick more and you will win more is one of rugby’s oldest arguments, and most coaches have heard it from the touchline. We tested it across thousands of matches from every variety of rugby, men’s and women’s, from amateurs to professionals. Teams that are winning kick more. Teams that kick more do not win more.
Winners and losers kick about the same amount
A team kicks from hand about 13 times a match, around one touch of the ball in fifteen. Winning teams kick a little more than losing teams, but by less than one kick a match, and that small gap is the whole of the evidence for the belief. Sort matches by raw kick count and the top quarter win about six in ten, against a little over half in the bottom quarter.
Raw counts mislead, because a team that kicks more may simply have had more of the game going its way. So we looked at kicks as a share of everything a team did with the ball, split matches into four equal groups from the least kicking to the most, and compared them. Every group won a little over half of its matches. The average winning margin even shrank as the kicking went up.
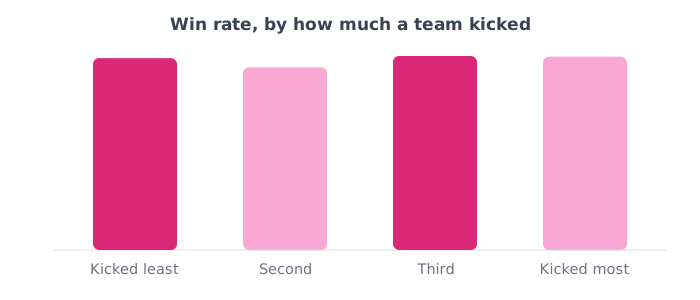
The same held inside a single team. Over a season, teams won about as many of their matches when they kicked more than usual as when they kicked less.
The scoreboard explains the gap
Teams change how they play with the score. When in front, a team kicks about one touch in fourteen. When level it is about one in fifteen, and when behind about one in eighteen. That makes sense: a team in front wants to play in the other half and run down the clock, and a team behind needs the ball in hand.
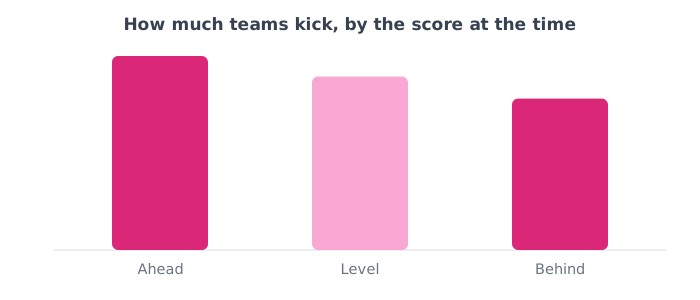
Winners spend most of a match in front, so most of their kicks happen there, and that is where the small gap comes from. Compare like with like and the picture flips: at the same scoreline, the team that goes on to lose kicks more than the team that goes on to win. That is true when ahead, when level and when behind.
Heavy kicking early is a warning sign
The first twenty minutes are the cleanest test, because the scoreboard has had less time to shape how a team plays. Teams in the quarter of matches with the least early kicking went on to win about six in ten. Teams in the quarter with the most won a little under half.
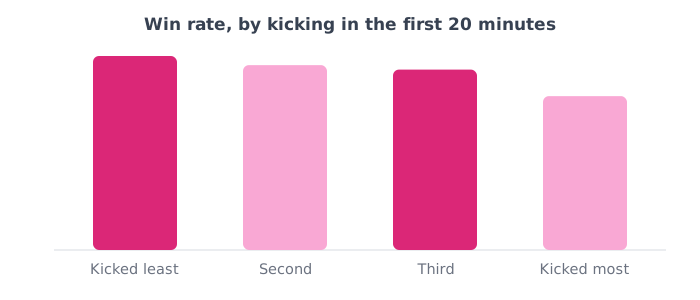
That does not mean early kicking loses matches. The likeliest reading is that a team under pressure in its own half has to kick to get out, and the kicking count picks up the pressure. Either way, it is hard to read a lot of early kicking as a sign that a game plan is working.
What to do with this
Stop judging your kicking by how much of it there is. A kick count on its own tells you almost nothing about whether the plan worked, and “we need to kick more” is not a game plan. Look at where the kicks came from, whether you were choosing to kick or being forced to, and what happened next.
If your team kicks a lot in the first twenty minutes, ask whether that was the plan or whether you were pinned back. If you were pinned back, look at your exits and your set piece. For the shape of kicking itself, see how far rugby teams kick, and for the same trap with a different number, the myth of possession. Getting this for your own team means someone recording each kick and the score when it happened, which analysis software can do for you.
How we worked this out
Based on tens of thousands of kicks from hand across thousands of fully analysed full-length matches spanning every variety of rugby, men’s and women’s, from amateurs to professionals, deduplicated so no fixture is counted twice. A touch is a carry, pass, offload or kick by the analysed team, and the score comes from the tries and kicks recorded up to that moment. That rebuilt score is reliable across many matches, though a single scoreline can be slightly out, so drawn matches are left out. Kicks are the least completely recorded event we use for this, and about a fifth of matches show fewer than eight, so we repeated the test without them: the four groups came out almost level, which is the check that thin records are not hiding a real effect. Within teams, we compared matches above and below each team’s own usual share, for teams with at least eight decided matches. One caveat: this is what teams did and how matches ended, not a controlled test, and analysed teams are often the stronger side. Kick detail is recorded for the team being analysed, the side of the game our data captures most completely.
Hero photo: lisa schlager, CC BY 2.0, via Wikimedia Commons.