Having more of the ball wins a rugby match less often than people think: in the matches where we analysed both teams, the side with more possession won fewer than three games in five. Possession is the stat that gets read out at half-time as if it decides everything. The team with more of it nods along, the team with less of it gets told to “keep the ball.” We have said before that possession barely predicts who wins, and this time we can prove it properly, because we went to the matches where we analysed both teams and asked the simple question: did the side with more of the ball win?
The team with more ball won under three in five
Across the matches where we tracked both sides, the team that had more of the ball won fewer than three games in five. That is better than a coin toss, but only just, and nowhere near the certainty the half-time graphic implies. More possession helps a little. It settles almost nothing.
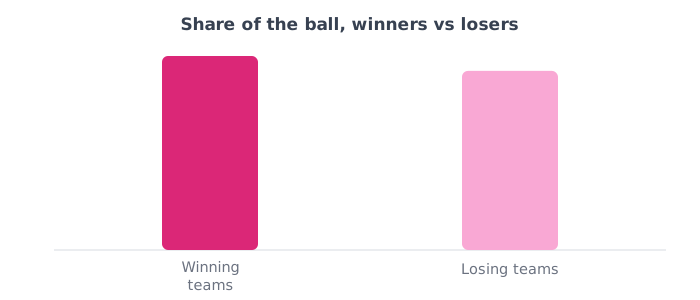
Winners barely had more of it
Look at the winning teams and their share of the ball sits just over half. Not two-thirds, not some commanding grip on the game, just a shade more than their opponents. The matches are not being decided by one team hogging the ball and the other starving. They are being decided by what each side does with the roughly equal share they get.
When possession is close, it is a coin flip
Split the matches by how lopsided the possession was and the myth falls apart completely. When the two teams shared the ball fairly evenly, which is most matches, the result was a coin flip. Only when one side genuinely dominated possession did it start to tell, and even then it was around two in three, not a foregone conclusion. Having a bit more of the ball is worth almost nothing. Having far more is worth something, but never as much as the number suggests.
What this means for your team
Stop chasing possession as a goal in itself. The scoreboard does not reward minutes with the ball, it rewards points, and points come from what you do with each visit: how quickly you recycle, how clinically you finish, how well you turn territory into a shot. A team that has the ball less but uses it better beats a team that hoards it and stalls, every time. Measure your points per entry into the opposition 22, not your possession percentage.
How we worked this out
This question needs both teams, and most footage only captures one side in full, so we used only the matches where we analysed both teams completely, hundreds of them, from across every variety of rugby, men’s and women’s. Possession is each team’s share of the ball activity we recorded, the passes, carries and rucks that only happen when you have it, and the result comes from the tagged scoreboard. One honest caveat: this is an association, not proof of cause, and analysed teams are often the stronger side in their fixtures. The pattern, that possession is a weak guide to winning, is emphatic enough to trust. For where points really come from, see where tries actually come from.
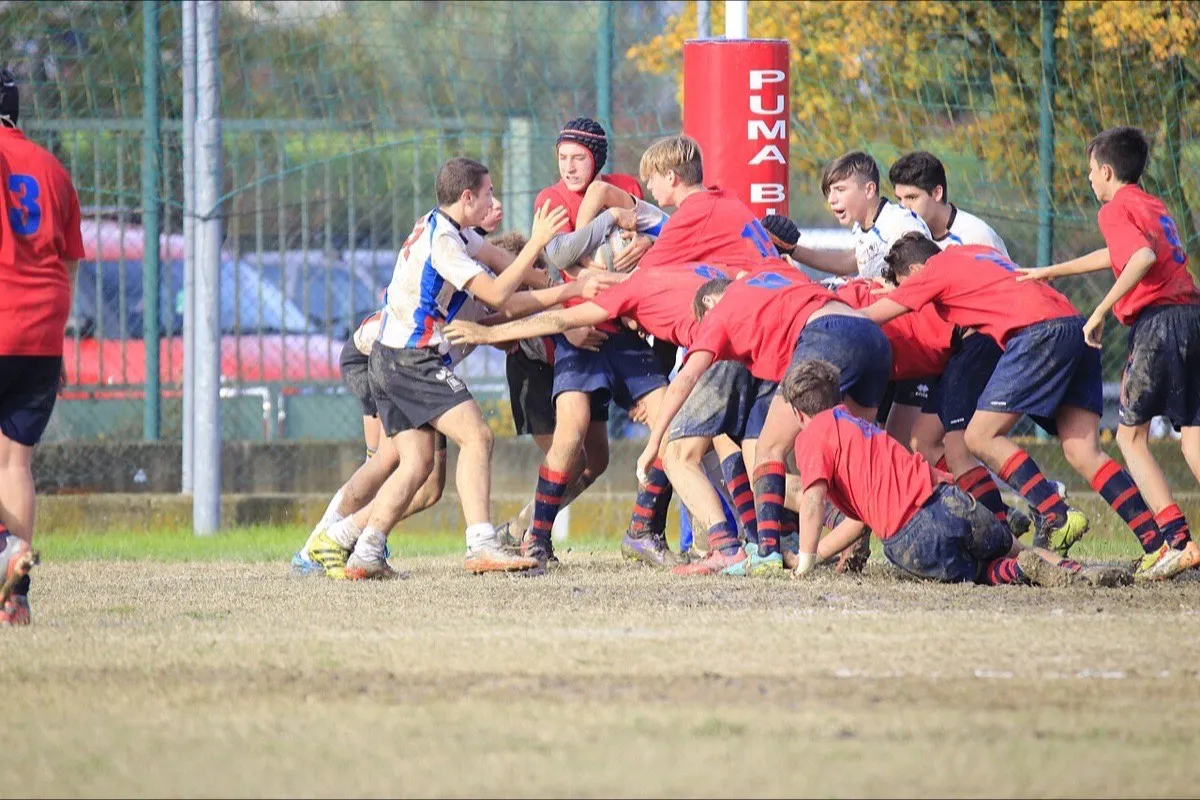
Hero photo: Assianir, CC BY-SA 4.0, via Wikimedia Commons.