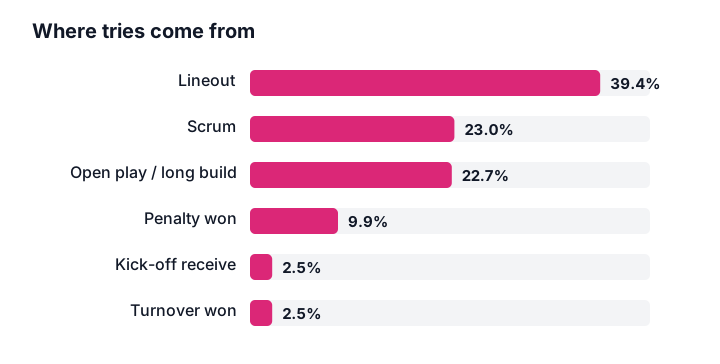
More than six rugby tries in ten start at a set piece, about four in ten from a lineout and nearly a quarter from a scrum. Every coach has a theory about where tries come from. The forwards will tell you it is the set piece, the openside will tell you it is the breakdown steal, and the backs will tell you it is whatever they did on Saturday. We traced tens of thousands of tries back to the possession that produced each one, and the argument now has an answer.
Set piece first, daylight second
Traced to the source of possession, tries break down like this: about four in ten start from a lineout and nearly a quarter from a scrum, roughly a quarter from open play or a long build-up, one in ten from a penalty won, and only a few in a hundred each from kick-off receives and turnovers. Add the lineout and scrum together and more than six tries in ten start at the set piece.
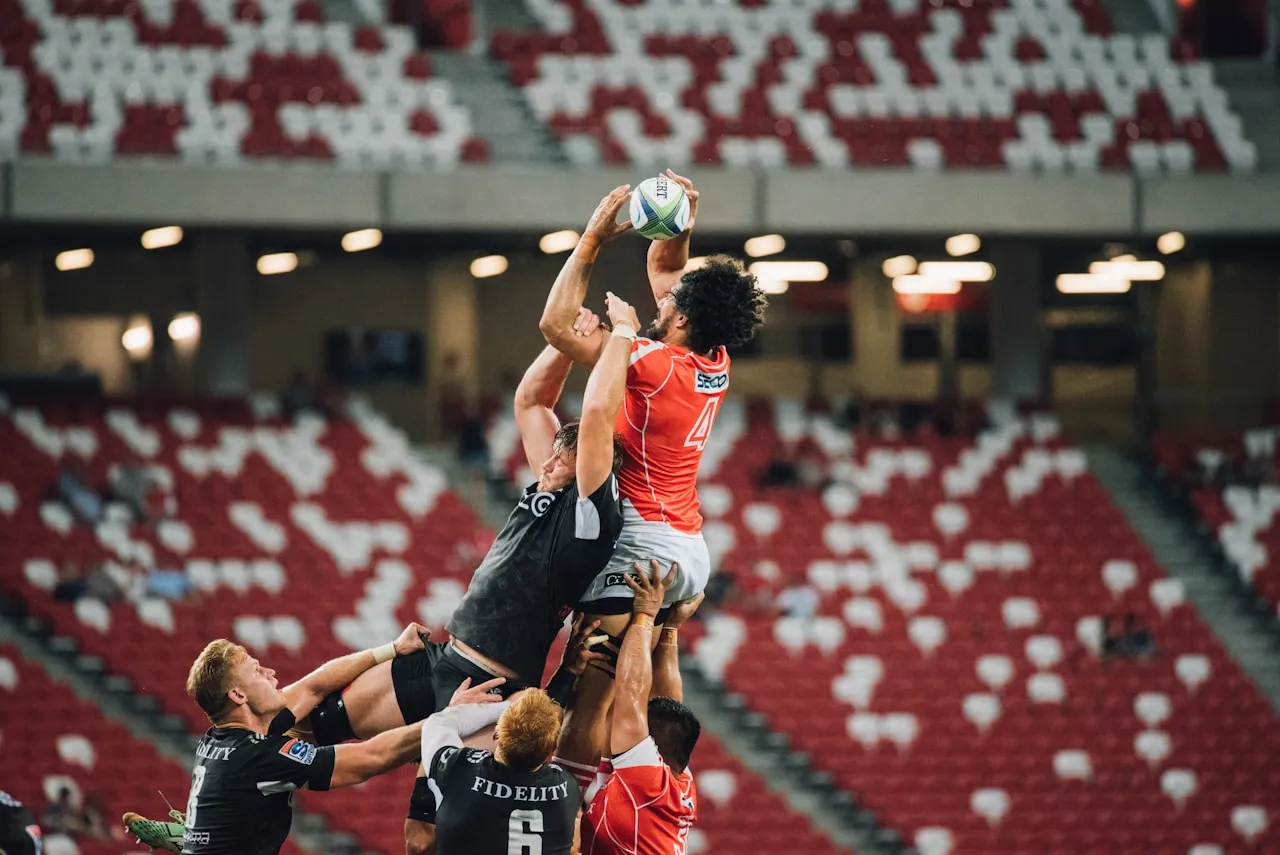
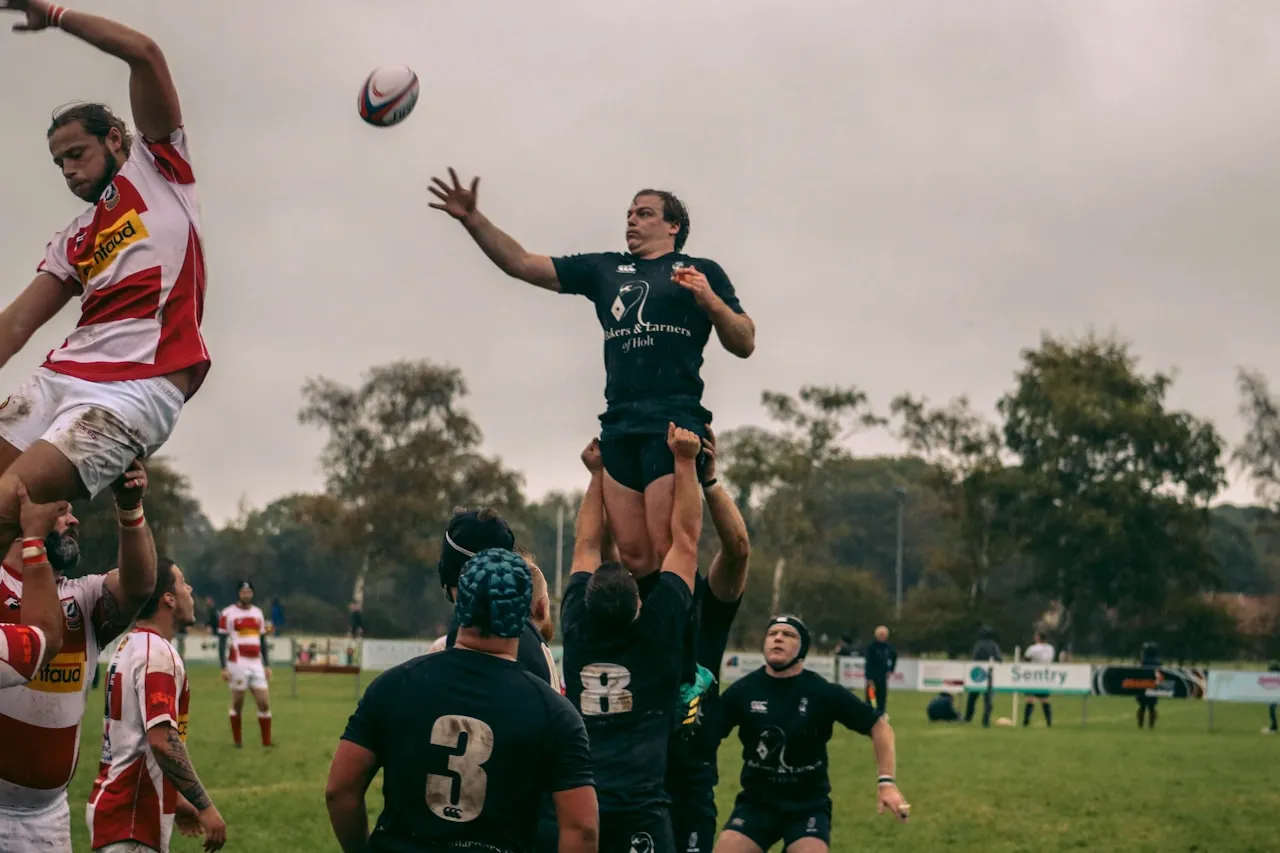
The lineout’s dominance deserves a moment. It is not just that lineouts happen often, it is that they are rugby’s best try platform: the drive, the peel, the strike off the top. Almost half of all set-piece tries in our data flow from the throw-in. If your lineout is a coin flip, you are not losing possessions, you are losing your single biggest source of tries.
The scrum try takes about a dozen seconds
Timing the gap between winning possession and scoring tells you how each source produces its tries. The median scrum try arrives only about a dozen seconds after the put-in: one phase, maybe two, a strike move hitting a defence that has eight players bound and backs still spread for the set. The median lineout try takes about half a minute, the drive and its aftermath. And the fastest of all is the turnover try at under ten seconds: rare, but when it comes, it comes instantly, against a defence shaped to attack. Turnover ball is the closest thing rugby has to a free shot, which is exactly what our kicking data suggested about winning the ball back in good positions.
The quarter that comes from nowhere
About a quarter of tries could not be traced to a set piece, penalty, restart or turnover within two minutes: sustained pressure, multi-phase sequences, broken-field rugby. That is a meaningful share, and it rewards fitness, ball retention and patience. But flip the number: at this level, three-quarters of all tries trace directly to a discrete, coachable moment, a throw, a put-in, a penalty won, a kick-off caught. The romantic nine-phase try exists, it is just outnumbered three to one by tries that started with a set-piece rehearsal on a Tuesday night.
What to do with this
Budget your training time like the scoreboard budgets its tries. If the set piece produces six tries in ten, it should not be getting two minutes at the end of the session, and the lineout, in particular, deserves the attention usually lavished on elaborate backline moves. Rehearse first-phase strikes off the scrum, because the dozen-second try is a designed try. And treat penalties won as attacking possessions rather than breathers: one try in ten starts there. None of this says phase play doesn’t matter, it says the data knows where your next try is most likely coming from, and your gameplan should too.
How we worked this out
Based on tens of thousands of tries scored by analysed teams across thousands of fully analysed matches spanning every variety of rugby, men’s and women’s, from amateurs to professionals, deduplicated so no fixture is counted twice. Each try is attributed to the most recent possession-start event we tagged, a lineout or scrum won, a penalty won, a kick-off received or a turnover, provided it occurred within two minutes of the try; tries with no such marker inside two minutes are classed as open play or long build-up. Figures reflect the analysed team’s tries, the side of the game our data captures most completely. For the wider numbers, see rugby by the numbers.