The average rugby match ends with the winner on more than double the loser’s points, a margin of around three converted tries, and a little over a quarter of matches finish within one score. Ask what a normal rugby score looks like and you usually get a shrug, so we rebuilt the scoreboard for thousands of matches, from every variety of rugby, men’s and women’s, from amateurs to professionals, try by try and kick by kick. The “average” game turns out to be two very different games wearing the same coat.
The average match is a comfortable win, not a nail-biter
The winning side, on average, racks up more than double the loser’s points, at a margin of around three converted tries. That is a wider gap than the professional game, where a tight, low-margin finish is a normal Saturday. On average, community rugby is not close.
But the average is a lie
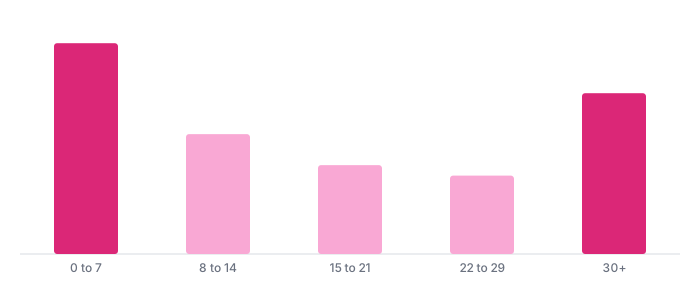
The typical game is much closer than that average suggests, because the spread is split in two. A little over a quarter of matches finish within one score. But about a quarter finish with a margin of thirty points or more, and a good number by fifty-plus. So about a quarter of games are genuine nail-biters and about a quarter are routs, and the other half sit in between. The blowouts are what drag the average out. Strip them away and the typical competitive fixture is a two-score game.
Why so many blowouts?
At community level the gap in quality between two clubs can be enormous in a way it rarely is between professional sides: a settled first XV against a team missing six regulars, a well-drilled school against one that took up the game last term. And rugby is unforgiving when the gap is real, because tired defences leak late (the final ten minutes are the second-biggest scoring window in the game) and an early lead snowballs. The competitive quarter of your fixtures is where the season is decided. The blowouts, in both directions, mostly coach themselves.
What this means for your team
If you are the better side, the data says finish the job, because a healthy lead at this level tends to grow rather than hold, and there is no cruise control. If you are the underdog in a mismatch, the honest target is not the upset, it is staying inside one score for as long as you can and building the habits that make next season’s version of the fixture the competitive kind. And for everyone: judge your season on the close quarter of your games, because those are the ones that turned on a decision rather than a mismatch. Which decisions to focus on is a question for the metrics that matter.
How we worked this out
Based on thousands of fully analysed rugby matches spanning every variety of rugby, men’s and women’s, from amateurs to professionals, deduplicated so no fixture counts twice. We reconstruct each scoreline from tagged tries, conversions, penalties and drop goals, then look at winners, losers and margins rather than “us and them”, because teams that analyse their matches win only around half of them in this data, so the two sides here are roughly balanced. One honest limit: a reconstructed scoreline occasionally misses an untagged kick, so we validated it against matches where we also hold the official result, and it lines up closely, which is why the averages here are solid even when a single game is off by a kick. For how those points arrive through a match, see the first 20 minutes.
Hero photo: David Molloy Photography, CC BY 2.0, via Wikimedia Commons.