Close games and blowouts are both common in rugby. A little over a quarter of matches finish within one score, and about the same share end with a margin of thirty points or more. Every coach wants to know early which of the two they are in. We followed thousands of matches from half time to the final whistle, from every variety of rugby, men’s and women’s, from amateurs to professionals, to see how much the break tells you. Blowouts nearly always show by half time. Close games do not, and they tend to be decided in the last twenty minutes.
Four blowouts in five were already more than two scores apart at half time
Take every match that finished thirty or more points apart and look back at the break. About four in five were already more than two scores apart at half time. Fewer than one in ten were within a score.
Blowouts do not come from a second-half collapse either. In a blowout, as in a close game, the points split roughly evenly between the two halves. The gap is usually there from the first quarter and keeps growing at much the same rate.
A close half time guarantees nothing
Of the matches within one score at the break, fewer than half finished within one score. About half ended with a margin of eight to twenty-nine points, and about one in twenty turned into a blowout.
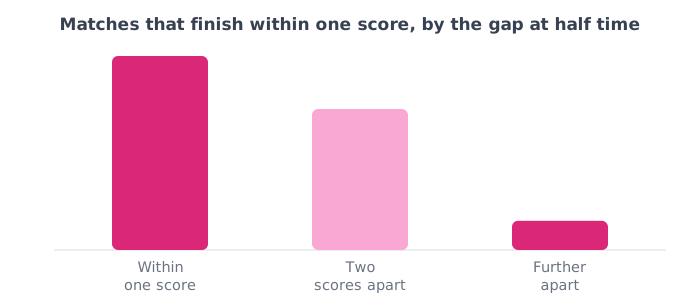
Two scores apart at half time, about a third of matches still finished within a score. So plenty of close finishes involve a team clawing back from well behind: more than a third of the matches that ended within one score had been two scores or more apart at the break.
One-score games are won late
The biggest difference between the two kinds of game is when the winner takes charge. In a match that ends within one score, the eventual winner goes ahead for good in the last twenty minutes about half the time, and in the last ten minutes more than a third of the time. In a blowout the winner is usually in front from its first score to the last.
That late window is where a one-score lead is at its most fragile, and where a close game is won or lost.
What to do with this
Use half time to tell you which game you are in, and trust it more in one direction than the other. More than two scores down at the break, the match will very likely end the same way, so the second half is a chance to fix one or two things for the next meeting. Within a score, nothing is settled, and the thing to plan for is the last twenty minutes: who is on the field, who kicks, and what you do with a lead of a single score.
The close games are the ones worth reviewing hardest, because a handful of moments in the final quarter decided them. Having every match recorded so those moments are easy to find is less work than it used to be: is video analysis worth it for an amateur team?
How we worked this out
Based on thousands of fully analysed full-length matches spanning every variety of rugby, men’s and women’s, from amateurs to professionals, deduplicated so no fixture is counted twice. We rebuilt each scoreline from tries, conversions, penalties and drop goals, found half time from the natural break in the recorded events, and compared the score at the break with the final result. A one-score game is a final margin of seven points or fewer, draws included, and a blowout is thirty or more. The method checks itself: the two halves it finds come out almost the same length, a little over forty minutes of recorded play each. To find when a winner went ahead for good, we took the last moment in the match at which they were not in front and measured the time left after it. One honest caveat: a rebuilt scoreline occasionally misses an untagged kick, which can blur a single match but not the rates across thousands. Analysed teams are often the stronger side, but these figures describe margins and timing within each match rather than who won.
Hero photo: Carlos Delgado, CC BY-SA 3.0, via Wikimedia Commons.