
Every club knows the rhythm of its own season, and almost nobody sees the shape of everybody else’s. We hold the match date for thousands of fully analysed games from every variety of rugby, men’s and women’s, from amateurs to professionals, which is an odd and rather nice thing to be able to look at. Rugby is far more concentrated into a single day of the week than it feels from inside one club, and the gaps between matches are more uniform than most fixture lists suggest.
Saturday is nearly half of all rugby
Take every match and sort it by day of the week and the answer is emphatic: close to half of all rugby happens on a Saturday, and the weekend as a whole carries about three matches in five. Nothing else comes close.
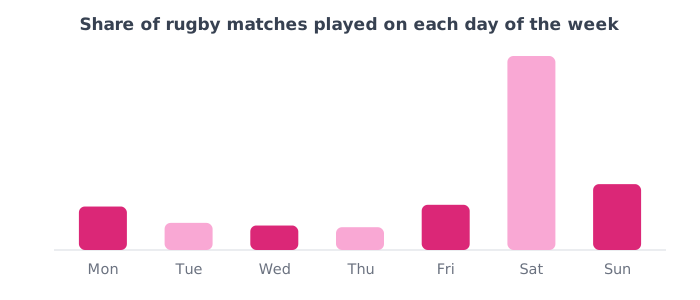
The interesting part is the rest. Tuesday to Thursday together carry roughly one match in five, which is a much larger midweek game than the Saturday-shaped picture in most people’s heads, and it is mostly schools and colleges playing on afternoons the adult game never uses. Friday is busier than any single midweek day, which is the same story a few hours later.
You get a week between matches, and sometimes three days
Line up each team’s own fixtures in order and measure the gap between them. The median is exactly seven days, which is unsurprising, and about a quarter of all consecutive matches land precisely a week apart. What is more useful is the spread around it: roughly one turnaround in seven gives a team three days or fewer.
That is the number worth planning against. A seven-day cycle is comfortable enough that most review routines are built for it, and then one week in seven the fixture list hands you a Tuesday game after a Saturday and the whole routine has to compress into something that fits in an evening.
December is the one month the game stops
Rugby’s calendar is famously split across two hemispheres, and our data covers both, so we expected the year to look flat. Mostly it does. The one genuine exception is December, which drops away against the months either side of it in every year we hold, and is the only month where that dip repeats rather than being a quirk of one season. Everything else that looks like a seasonal pattern in the raw counts turns out to be our own growth rather than the sport’s calendar, which is a caveat we would rather state than dress up.
What to do with this
If you are building a review routine, build it for a seven-day cycle and then decide in advance what the three-day version looks like, because you will need it several times a season. Practically that means knowing which one or two things you would still watch if you only had twenty minutes - and having that decision made in September rather than improvised in February. Our post on what to look at first after a match covers the short version of that routine.
How we worked this out
Based on the recorded match dates across thousands of fully analysed matches spanning every variety of rugby, men’s and women’s, from amateurs to professionals, deduplicated so no fixture is counted twice. Day-of-week and turnaround figures are proportions rather than counts, which is deliberate: the number of matches we hold has grown a great deal over the window, so any raw monthly or yearly total measures our own footprint as much as the sport, while the shape within a week does not move with that growth. We checked the day-of-week split over the most recent twelve months alone and it matches the full history closely, which is the check that we are describing rugby rather than our own history. One honest caveat: the recorded date is the date attached to the match by the team, and a small number of those will be the day the footage was handled rather than the day it was played, which would spread a little weight from Saturday onto the days after it. The December finding is deliberately stated as a direction rather than a size, because separating it from growth cleanly is not something this data can do.
Hero photo: Photograph by Clem Rutter, Rochester, Kent, CC BY-SA 3.0, via Wikimedia Commons.