The first block of the season is the most dangerous time to read a stat sheet. You have three matches of data, everyone is fit, the selection is still moving, and every number looks like a trend. We took teams with a full season of fully analysed matches behind them, compared what their first three games said against what the rest of the season actually did, and sorted the numbers into the ones that held and the ones that did not. How your team plays shows up almost immediately. What your team achieves does not.
The style numbers settle fast
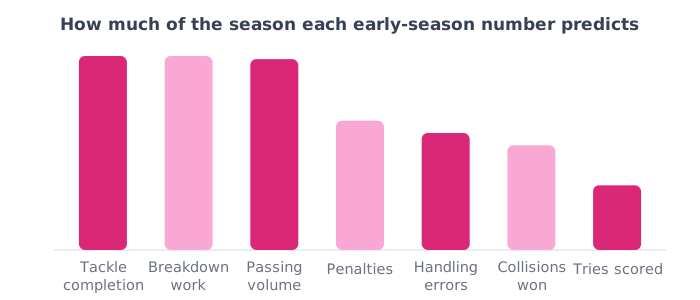
Three metrics held their shape from the first three games right through the rest of the season: tackle completion, breakdown work rate, and passing volume. If a team completed tackles well in August, it completed them well in April, and the typical gap between the early figure and the season figure was only a few per cent.
That makes sense once you say it out loud. These are measures of how a side is coached and how it prefers to play. A team that arrives at rucks in numbers keeps arriving at rucks in numbers, and none of that is contingent on who you happened to draw in the opening block.
The outcome numbers tell you almost nothing
Tries per match was the weakest signal on the board by a distance. A team’s scoring rate over three games barely relates to its scoring rate over the following season, and the typical gap between the two was close to a third. Handling errors were nearly as unreliable, and so was the share of collisions won.
This is the part worth internalising before round one. The numbers you will most want to act on in September are the ones least worth acting on. Tries, errors and collision dominance move with the opposition, the weather and the referee. Three matches is not enough to see through that, and the temptation to reorganise a season around a good or bad opening block is exactly the mistake the data warns against.
Four games is meaningfully better than two
We ran the same test using two, three, four and five opening matches, because the obvious objection is that three is an arbitrary number we picked to make a point. Mostly the answer held: the style metrics were already reliable at two games and got slightly better with more.
The exception was scoring rate, which was close to meaningless at two and three games and then improved sharply at four. If there is a threshold anywhere in this data, it is there. A month of rugby is a genuinely different amount of information from a fortnight of it, and it is the outcome numbers rather than the style numbers that need the extra time.
What to do with this
For the opening block, judge your team on how it played and not on what it produced. Tackle completion, work at the breakdown and passing volume are fair game from the first weekend and will tell you whether preseason took. Leave scoring rate, error counts and collision dominance alone until you are four or five matches in.
Practically, that means setting up to capture the reliable things from the start: squad and jersey numbers in place before round one, footage from the first fixture, and a metric or two you actually intend to follow rather than a dashboard you will ignore by October. The anatomy of an average rugby match is a useful benchmark to place yourself against.
How we worked this out
Based on teams with at least six fully analysed matches, drawn from thousands of matches spanning every variety of rugby, men’s and women’s, from amateurs to professionals, deduplicated so no fixture is counted twice. For each team we took the mean of a metric across their first three analysed games and compared it against the mean across every game after that, then measured how strongly the two moved together across all teams. Ordering is by when a match entered the system rather than by a kickoff date, which is the closest thing to a fixture sequence this data holds. One honest caveat: a team’s first three analysed matches are not necessarily its first three matches of a season, since clubs start recording at different points, so read this as “the first three you have on file” rather than “the first three you played”. The check that the method is measuring something real is the sensitivity test above: if the answer were an artifact of choosing three, the picture would have moved at two and five, and for the style metrics it did not.
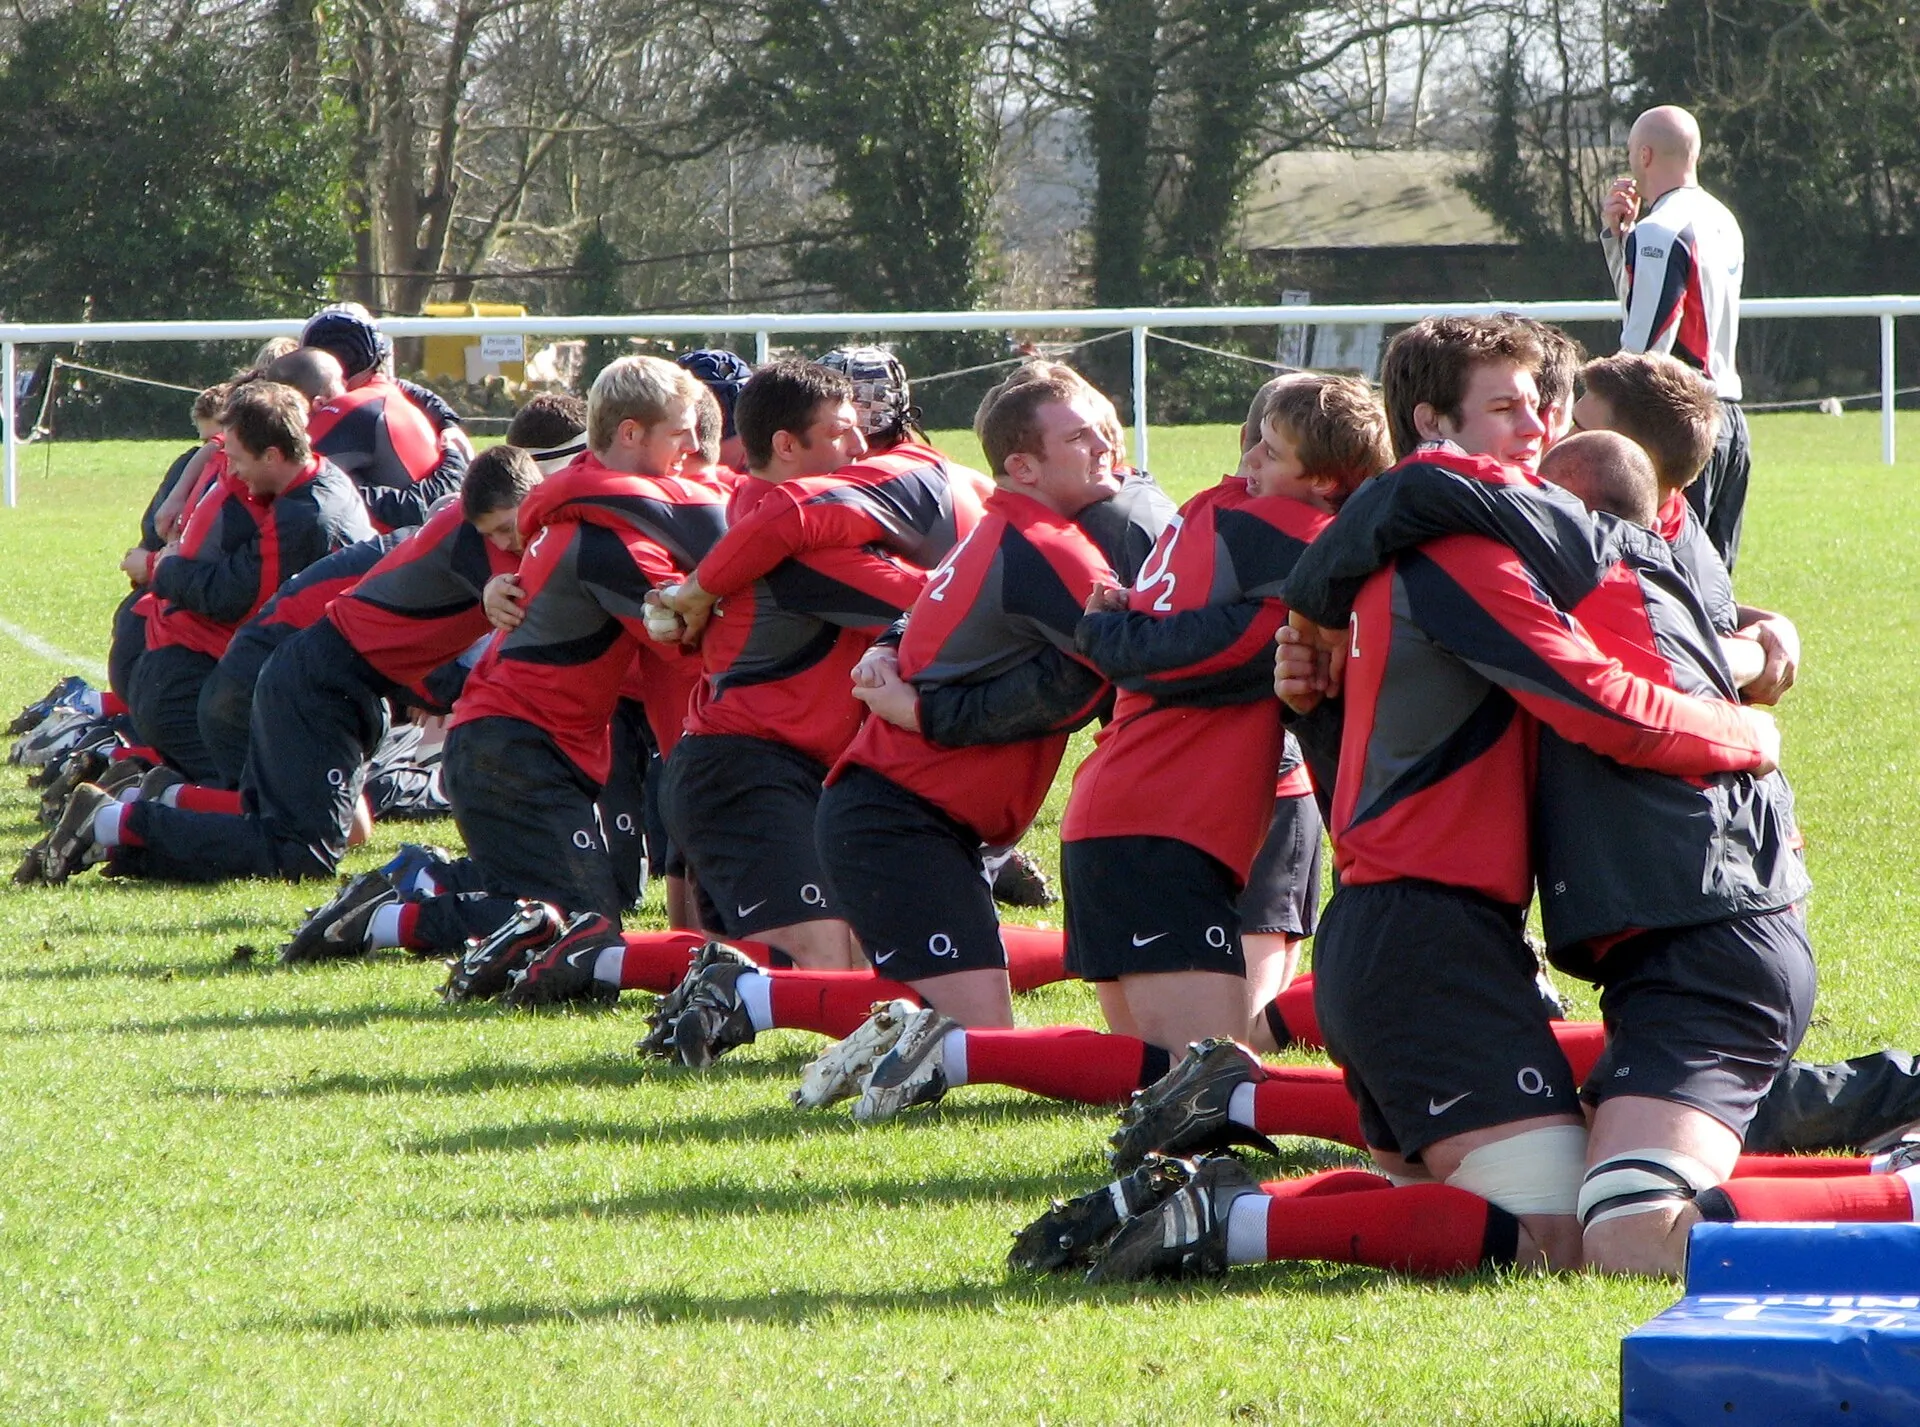
Hero photo: Adrian Pingstone, public domain, via Wikimedia Commons.