Rugby teams score slightly more tries in the second half than the first, and do slightly less of everything else; that small gap is the whole of the famous second-half fade. Preseason runs on a single article of faith: matches are won in the last twenty minutes by the team that is still standing. Fitness beats skill when everyone is tired, so the hill sprints in August pay off in November. We wanted to see the tiredness in the data. We split thousands of fully analysed matches at half time, from every variety of rugby, men’s and women’s, from amateurs to professionals, and compared what teams did in the first half with what the same teams did in the second. There is a fade. It is much smaller than the story.
The ball moves a little less, and that is most of it
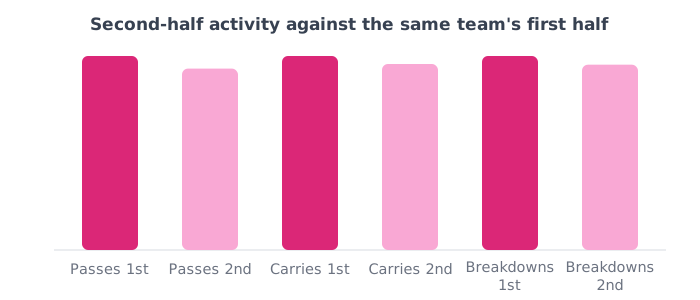
The clearest second-half change is in ball movement. Passes, carries and breakdowns all drop, and they all drop by roughly the same modest amount: a few per cent, not a collapse. Teams keep playing the same game slightly more slowly. Nothing in the numbers looks like a team running out of legs, which is what the folklore predicts and what a coach watching from the touchline is convinced they can see.
Defence slips, by about a point
Tackle completion is the one place a fatigue story should show up loudest, and it does move in the expected direction. Teams complete a slightly smaller share of their tackles after the break than before it, but the gap is around a single point. If you had to spot that from the stand, across eighty minutes, you could not.
More telling is what does not move. The share of collisions won by the carrier is unchanged between halves. Defenders miss a fraction more tackles late on, but the ones they make are no softer. That is a specific and slightly surprising result: the thing that decays is coverage, not power.
Discipline and handling hold up completely
The other half of the fade story is that tired players get sloppy. Our data does not support it. Penalties conceded are essentially identical across the two halves, and handling errors are, if anything, marginally lower after the break. Whatever else fatigue does to a rugby team, it is not making them clumsier or less disciplined in any way we can measure.
Scoring goes very slightly the other way: tries come marginally more often in the second half than the first, which fits what we found when we mapped when tries actually happen. Defences do not fall apart, but they leak a fraction more than they did.
What to do with this
Keep the fitness work, and change the reason you sell it. The second half is not where teams collapse, so promising your squad that conditioning will make the opposition fall over is a promise the data will not keep. What conditioning buys is narrower and more valuable: the tackles you would otherwise miss, and the ability to keep playing at first-half tempo when the other side has quietly slowed down. Those are worth a few points a season, which is plenty.
The other implication is about your review. If you have been attributing second-half defeats to fitness, the numbers suggest looking elsewhere first, at your bench, your decision-making under a scoreboard, and how often a half-time deficit gets overturned at all. Fatigue is a small effect wearing a big reputation.
How we worked this out
Based on thousands of fully analysed matches spanning every variety of rugby, men’s and women’s, from amateurs to professionals, deduplicated so no fixture is counted twice. We located half time inside each match by finding the longest break in recorded play landing near the middle of the game, and used only matches long enough to be a full fixture; the interval was identifiable in roughly three quarters of them, and the two halves came out almost exactly equal in length, which is the check that the method is finding what it claims to. Rates are per minute of each half so the comparison is not distorted by one half running longer. One honest caveat: our clock is the match as recorded, including stoppages, so a second half with more substitutions and injuries produces a slightly lower rate of play without anybody being tired. That works in the direction of overstating the fade, not understating it, which makes the small numbers here more striking rather than less. Team figures reflect the analysed team’s events, the side of the game our data captures most completely; try counts cover both sides.
Hero photo: The Fleuette-deGuzman Alliance, CC BY 2.0, via Wikimedia Commons.