Every coach believes the team that finishes a season is better than the team that started it. It ought to be. Thirty training sessions and a dozen matches is a lot of practice. So we tested it. From thousands of fully analysed matches spanning every variety of rugby, men’s and women’s, from amateurs to professionals, we took every team with at least eight full matches in a run and compared its first four with its last four. On the numbers we record, the average team finishes the season where it started.
Tackling, carrying, handling and discipline all end where they began
Tackle completion runs at about seven in ten early in a season and a shade under that late on. The share of carries won by the carrier does not move. Penalties conceded sit at about a dozen a match at both ends, knock-ons are unchanged, and attacking sequences run to the same three phases in the last month as in the first. The win rate is a little over half in both windows, which is what you expect when analysed teams are often the stronger side.
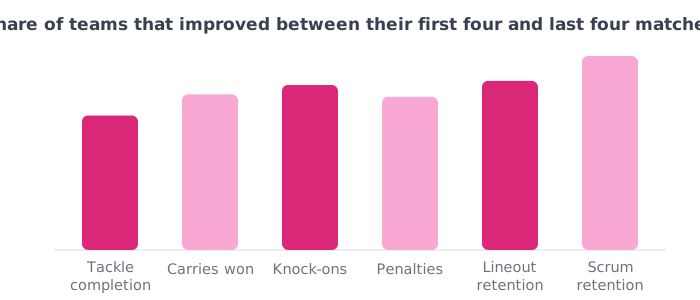
An average can hide real change if improvers and decliners cancel out, so for each measure we also counted the share of teams that got better. Then we shuffled every team’s fixtures into a random order hundreds of times and counted again, to see what chance alone produces. On every measure, the real share of teams improving sits inside or on the edge of the range that shuffling produces.
The scrum may settle a little, and both sides score more
Scrum retention is the nearest thing to an exception. Teams keep about nine of every ten of their own scrums early on and a little more than that late, and the share of teams whose scrum improved is the only figure that lands just outside the range chance produces. Treat it as a hint rather than a finding: test six measures and one will stray just past the edge about one time in four by chance alone, and fewer teams have enough scrums to count. The scoreboard does change: both the analysed team and its opponents score a couple of points more a match at the end of a season than at the start. Games open up. Margins do not move.
Teams change a lot. They just do not all change the same way
The average hides how much an individual team moves. Roughly a quarter of teams shifted their tackle completion by five points or more, and more of them went down than up.
Much of that movement is the season correcting itself. The third of teams that tackled worst in their first four matches gained a point or two by the end. The third that tackled best lost nearly four. The most-penalised third cut more than two penalties a match, and the least-penalised gave away two more. A bad first month is mostly not a trend, and a good one is mostly not a level.
Where a team’s completion did rise by two points or more, its average margin rose by about eight points over the same span, and where completion fell, the margin fell with it. Improvement, when it happens, shows on the scoreboard. It is just not something a season hands you.
What to do with this
Improvement is not a by-product of playing. Pick one or two numbers and judge them over eight matches rather than four, because a team’s completion swings by about six points from one match to the next; what good looks like gives you a yardstick. Expect your worst month to correct itself and your best to sag, and do not rebuild the defence after a bad fortnight. A real two-point gain in tackle completion is worth the training time, because it travels with the result. And if nobody at the team is keeping the numbers, is it too late to start analysing this season covers what a mid-season start looks like.
How we worked this out
Based on thousands of fully analysed matches spanning every variety of rugby, men’s and women’s, from amateurs to professionals, deduplicated so no fixture is counted twice. A team-season is one team’s matches in date order, split at any gap of more than three months, keeping runs of at least eight full matches; that gave over a hundred team-seasons, most of them senior men’s first XVs. We averaged each one’s first four and last four matches and took the difference, then repeated it with the first and last third of the run, which gave the same answer. The check that the method works is the shuffle: with each team’s fixtures in a random order, about half of teams “improve” on every measure, and the real figures land inside that band. One honest caveat: teams that keep analysing all season are not a random sample, and the early matches are already analysed matches, so any effect of analysis itself sits inside both windows. Scores are rebuilt from tries and kicks, reliable across many matches and not for any single result. Team figures reflect the analysed team’s events, the side of the game our data captures most completely.
Hero photo: Quino Al, CC0, via Wikimedia Commons.