
We collect thousands of data points on rugby teams, and the ones that get quoted back to us always come from the same two or three matches a season: the derby, the cup tie, the day it all went wrong. It is an odd thing to put in writing, then, that those matches barely move a league table. The season is decided in the games nobody talks about in the bar afterwards, and we can show you where they are.
A season is a quarter close games, a quarter routs, and the rest in between
Across thousands of full-length matches from every variety of rugby, men’s and women’s, from amateurs to professionals, a little over a quarter finish within one score. About the same share finish thirty or more points apart. Everything else, getting on for half, sits in between, and the typical margin is a bit more than two converted tries. Follow one team through a season and the same split appears: in a dozen matches, about four are one-score games, about three are routs in one direction or the other, and the rest are comfortable wins and losses.
The routs are decided by half time and nearly always show early. The comfortable ones were decided by the gap between the sides. Neither kind turned on a decision. The four close games did.
Four games decide the table
Take a team that wins half its matches, six from twelve, and splits its four close games two and two. Win the other two close ones and the season is eight and four, the sort of record that finishes near the top. Lose them all and it is four and eight, which is the bottom half. Nothing else about the team changed. The same forwards, the same pattern, the same routs won and lost. The whole difference between a good season and a poor one is what happened in four games decided by a kick, a dropped restart or a missed tackle in the last ten minutes.
That can look like luck, and some of it is. Across the team-seasons in our data the typical team wins about half of its close games, and as many teams win most of theirs as win few. What separates the two groups does not show on the scoreboard, because the scoreboard in those games is measuring a handful of moments.
Close games are in every month of the season
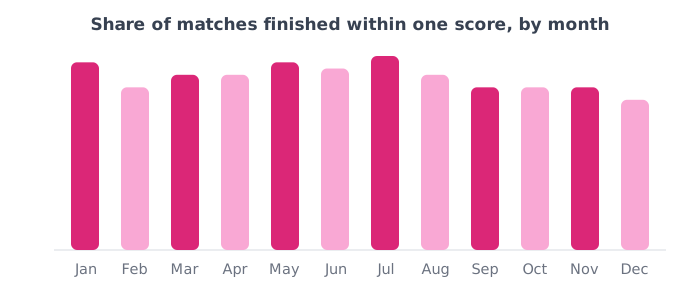
The natural assumption is that the close games are the big fixtures: the derby, the top-of-the-table match, the cup. Our data cannot tell a derby from an ordinary fixture, so it cannot say whether the derby is more likely to be close. What it can say is that the calendar does not make a game close: the share of matches that finish within one score is almost the same in every month of the year. A wet Saturday in November is as likely to produce a one-score game as a Saturday in April, it is worth the same points, and it does not feel like it, which is why nobody remembers it and nobody filmed it.
Nobody films the ordinary Saturday
Ask which matches got recorded last season and the answer is usually the big ones. Somebody’s parent brought a camera to the derby. The cup tie was streamed. The ordinary league game in the rain was watched by eleven people and a dog, and exists now as a score in a spreadsheet and three contradictory memories. So the footage a team owns is footage of the matches that were decided by the gap between the sides, and the matches that were decided by moments, the ones where a review would have found something, are the ones with nothing to review.
The case for filming everything is that you cannot tell in advance which four will matter, and the ones that matter tend to be decided late, in a handful of moments that are easy to find on video and impossible to reconstruct from memory on Monday.
What to do with this
Film every match, including the ones you expect to win by forty and the ones you expect to lose by forty, because the expectation is wrong about one Saturday in four. Review the close ones hardest, whatever the result; a close win is a game you nearly lost and should be treated like one. And judge the season on those four games rather than on the routs, because the routs would have gone the same way for anyone. If you want to know whether your team is getting better, that is where to look. It is also where analysis pays back fastest, because the moments that decide a one-score game are the kind a camera catches and a coach on the touchline does not.
The figures here come from thousands of fully analysed full-length matches, deduplicated so no fixture is counted twice, with scores rebuilt from tries and kicks and a one-score game taken as a final margin of seven points or fewer. The season figures follow each team’s matches in date order and keep runs of at least eight; there are well over a hundred such runs, most of them senior men’s first XVs. Analysed teams are often the stronger side, which is why they win a little more than half of their matches overall; it does not change the share of matches that are close, which is what this post is about.
Hero photo: U.S. Marine Corps photo by Cpl. Sarah Taggett, public domain, via Wikimedia Commons.