Most rugby statistics get published as averages, and an average is the least useful shape a number can have. It tells a coach where the middle is, not whether their own team is any good. So we went back through thousands of fully analysed matches, from every variety of rugby, men’s and women’s, from amateurs to professionals, and collected the whole spread instead: the weakest tenth, the middle, and what it takes to reach the top tenth. On most measures the gap between a poor team and a good one is much narrower than the coaching conversation assumes, and on one it is enormous.
Your tackle completion is probably fine. Your lineout probably is not.
Tackle completion is the number clubs worry about most and the one with the least room in it. The middle of the range completes about seven in ten attempts, the top tenth get past four in five, and even the bottom tenth land nearly three in five. A tight band, which means a team fretting about a rate a little under three quarters is fretting about being normal. There is more on it in what a good tackle completion rate looks like.
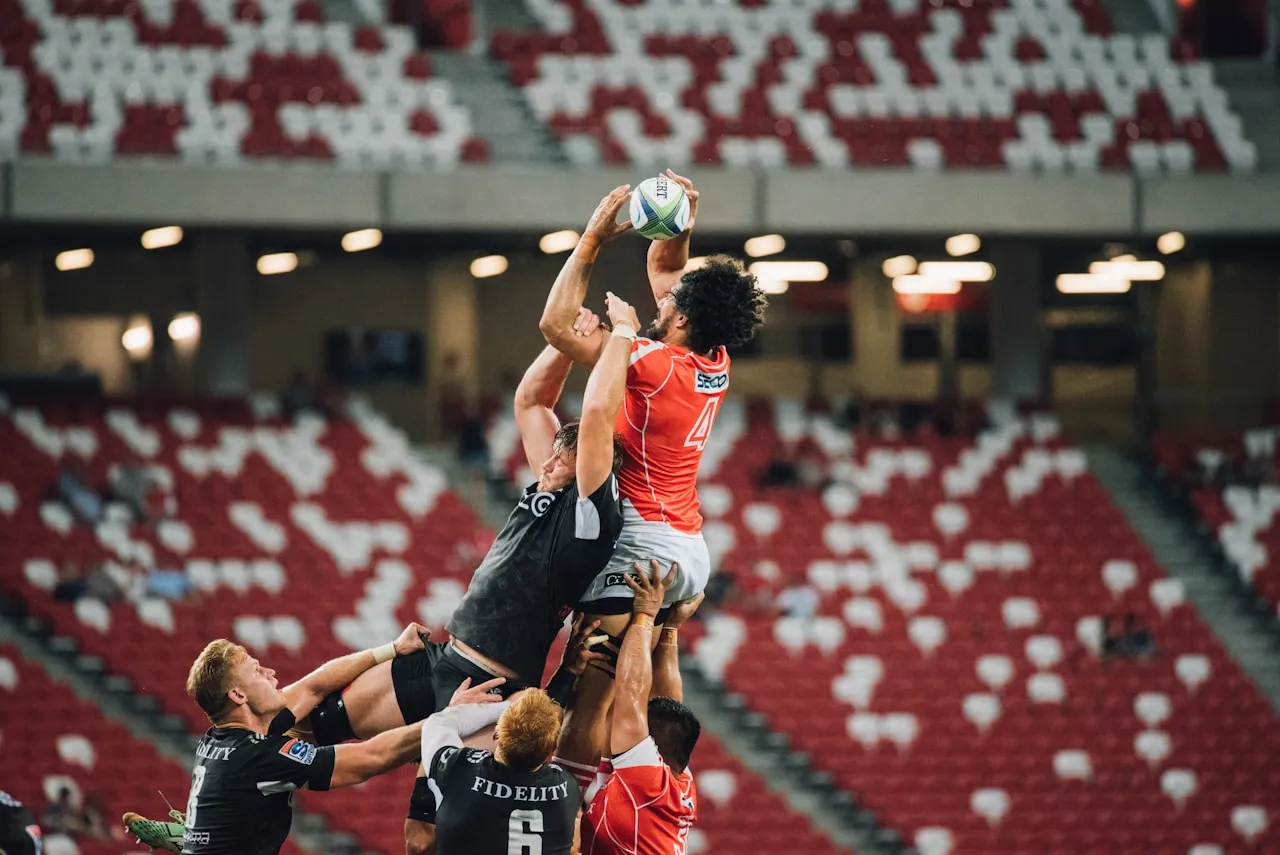
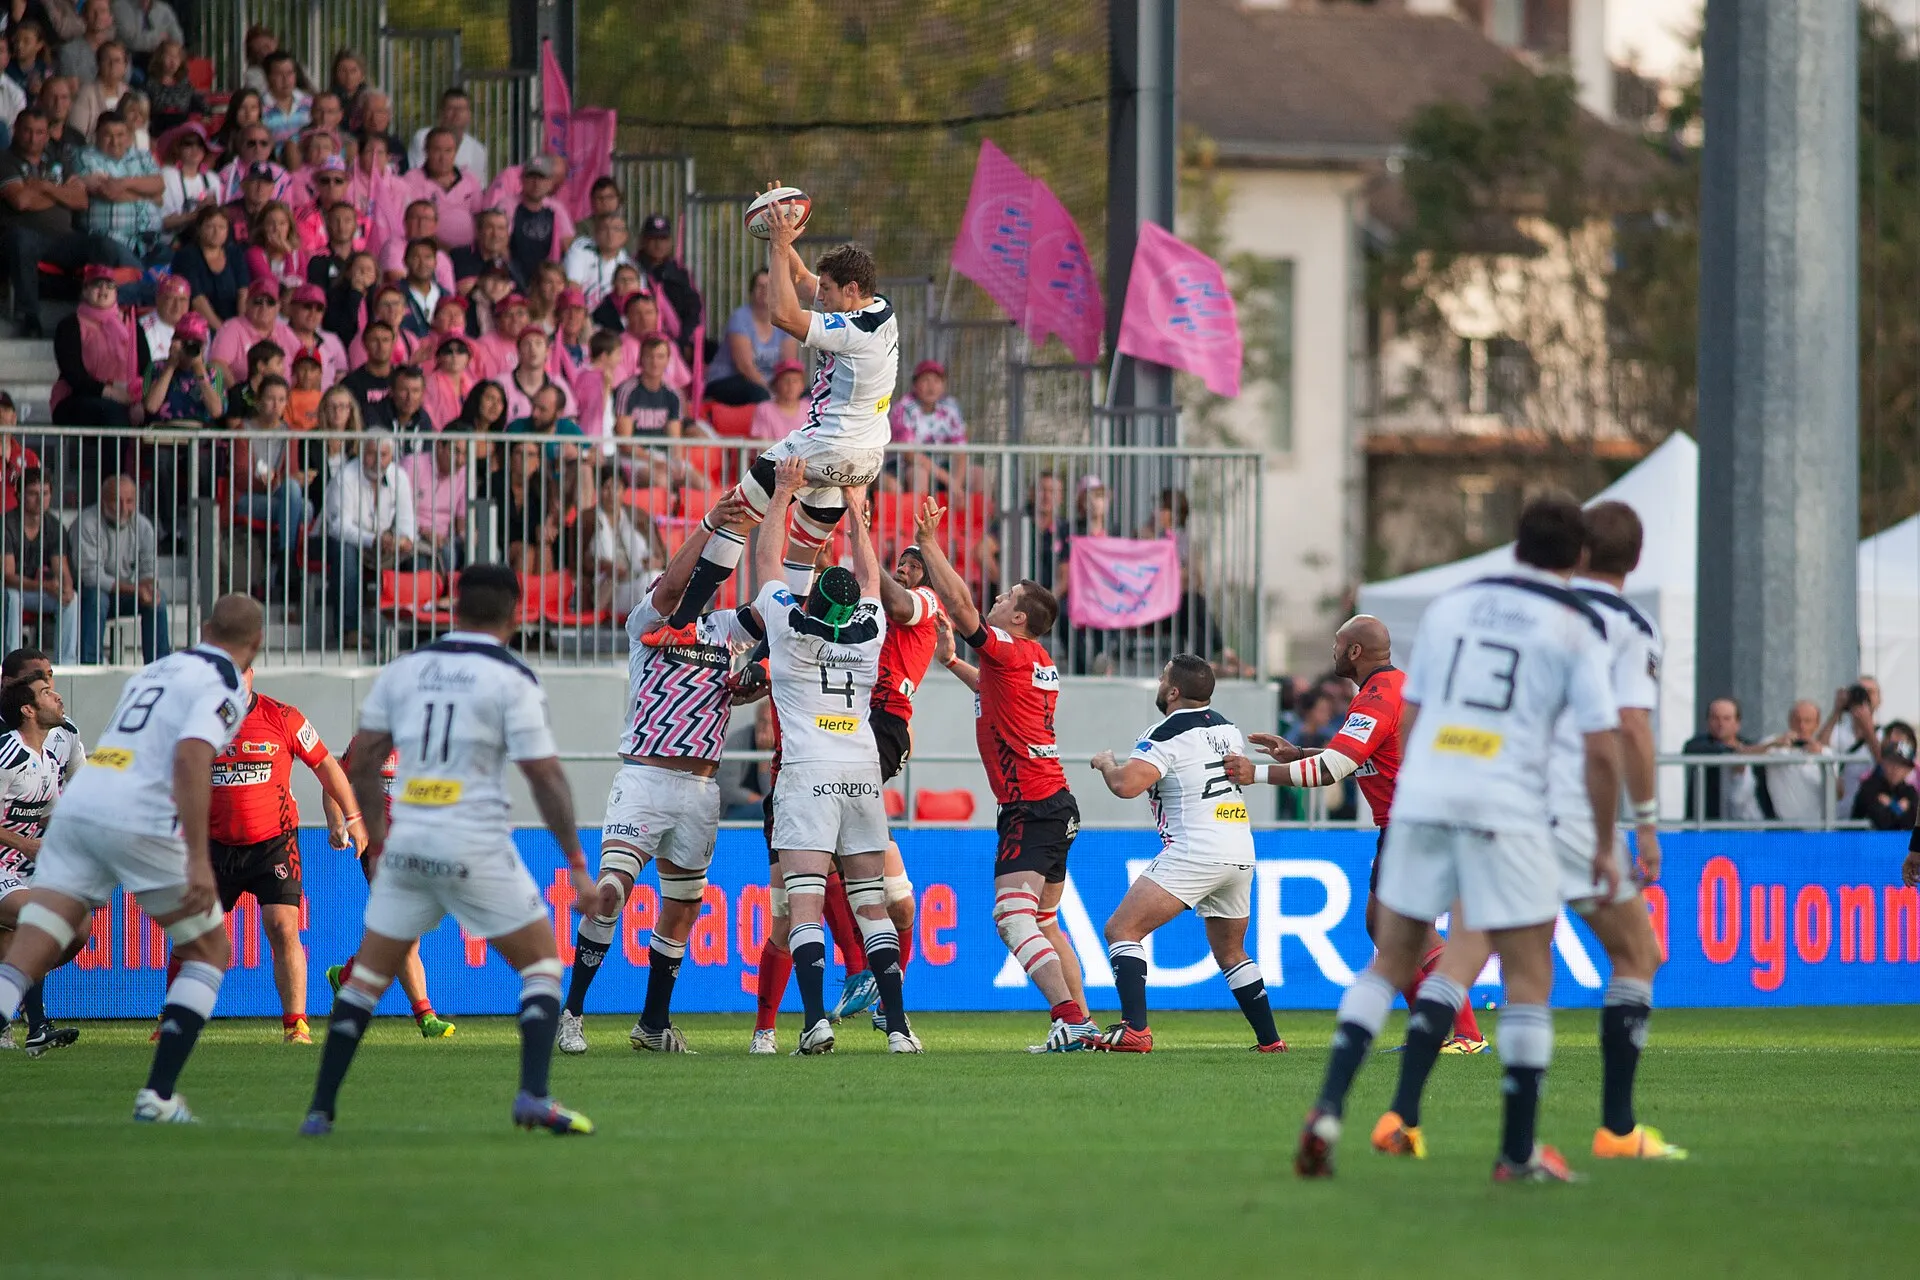
The lineout is the opposite. The middle of the range wins a bit over three in four of its own throws, the top tenth more than nine in ten, and the bottom tenth are down barely better than a coin toss on their own ball. A far wider spread than tackling, on the most coachable set piece in the game, and where a club with limited training time gets the most back.
Scrums are where almost everybody looks good
Scrum numbers flatter nearly everyone. The middle of the range wins more than nine in ten of its own put-ins, and about half of all teams lose none of their own scrums at all in a given match. Restarts behave the same way, clustered high with most teams close to perfect.
A metric where half the field scores full marks cannot tell you much, so a coach reviewing a clean scrum sheet has learned almost nothing. The information is in the rare failure, not the rate.
The widest spread in rugby is what you do once you get there
Now the outlier. Take how often a team turns a visit to the opposition 22 into a try and the range is enormous next to everything else we measure. The bottom tenth score on about one visit in five, the middle of the range converts a bit under half, and the top tenth convert around three in four.
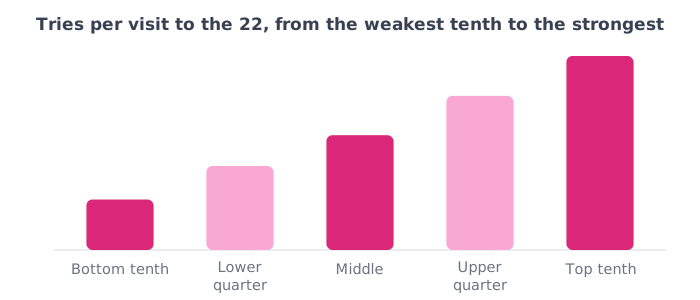
Nothing else spreads teams out like that, which is why it separates winners from losers so sharply in our ranking of what winning teams do differently.
What to do with this
Pick the two measures where you have most to gain rather than the two you already track. For most amateur clubs that is the lineout and the 22, not the tackle count. If your completion is near seven in ten you are inside the normal band, and hours chasing it move a number that barely moves your results.
For volume, the middle of the range is roughly seventy carries, a hundred passes, sixty breakdowns and getting on for a hundred tackle attempts in a match. Context numbers rather than targets, best read alongside what an average match contains. If your carry count is low and your results are fine, you are playing a different way, not a wrong one.
How we worked this out
Based on millions of recorded events across thousands of fully analysed matches spanning every variety of rugby, men’s and women’s, from amateurs to professionals, deduplicated so no fixture is counted twice. Each band describes one team in one match rather than a team’s season, and matches with too few of the relevant events to be meaningful are excluded, so a side that threw four lineouts does not appear in the lineout spread. The check that the method is finding what it claims to is that two independently recorded streams agree: the share of collisions won by carriers and the share lost by tacklers describe the same contacts from opposite sides and land within a point and a half of each other. One honest caveat, running in a single direction: teams appear here because somebody chose to analyse them, and analysed teams are often the stronger side, so if anything these bands sit a little high. Read the scrum and restart figures with the ceiling in mind, because when half the field records a perfect rate the percentiles compress and understate the real variation.
Hero photo: Fanny Schertzer, CC BY 3.0, via Wikimedia Commons.