Every coach has a theory about what separates the teams that win from the teams that do not. More possession. More carries. Fewer handling errors. We have enough rugby recorded to test the theories against each other rather than one at a time, so we ranked every metric we collect by one question: how reliably does this number tell you who won? We collected the answer across thousands of fully analysed matches spanning every variety of rugby, men’s and women’s, from amateurs to professionals. Almost everything on the list matters far less than where you play, and the most-quoted number of all points the wrong way.
Getting into the 22 separates teams more sharply than anything else we record
Take a team’s share of the visits to the 22 in a match and sort every match by it. Teams in the bottom quarter win about one game in seven. Teams in the top quarter win more than nine in ten. Nothing else we record comes close to that gradient, and the climb is smooth the whole way.
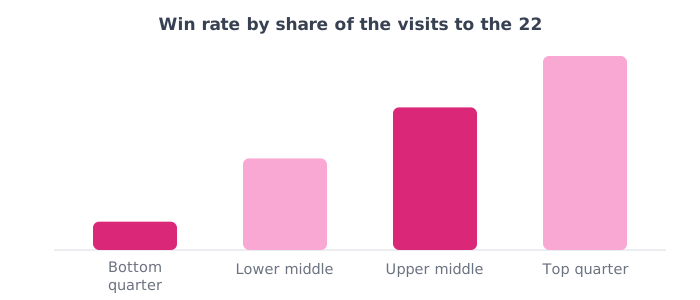
It is not a claim that territory causes wins. A team already ahead gets more chances to visit the 22, and the arrow runs both ways. What it does say is that if you track one thing, this is the one carrying the signal.
What you do inside the 22 is worth nearly as much, at both ends
The next two are the same measure pointed in opposite directions: how many of your own visits you turn into tries, and how many of theirs you let them turn into tries. Teams at the bottom for converting their visits win about one match in four; teams at the top win getting on for nine in ten. The defensive version has the same shape, which is the check that we are measuring the 22 rather than measuring attack.
Tackle completion is the best of what is left, and a clear step down: the least accurate quarter win about a third of their matches, the most accurate closer to seven in ten.
The numbers everyone quotes barely separate anyone, and one runs backwards
Raw volume is close to useless as a guide to who won. Sort matches by carries made, rucks hit or passes thrown and the win rate hardly moves across the whole range. Possession, measured as a team’s share of the breakdowns, moves it only a little further, which is the conclusion we reached when we went after possession directly.
Then the one that runs the wrong way. Teams that made a larger share of a match’s handling errors won more often, not less. That is not a discovery about handling. It is a reminder that a count on an attacking stat sheet mostly tells you who had the ball in dangerous places, and that an error column means nothing without the chances that produced it.
What to do with this
Cut your Monday review to two questions, and make both about the 22. How often did we get there, and what happened when we did? If your carries are up and your visits to the 22 are flat, you have had a busy afternoon rather than a good one.
It changes how you talk to players, too. A back rower who knocked on three times may simply have carried more than anyone else on the pitch, and coaching the error column without that context teaches players to play safe. Pair this with what a trip to the 22 is worth and what a realistic tackle completion looks like.
How we worked this out
Based on millions of recorded events across thousands of fully analysed matches spanning every variety of rugby, men’s and women’s, from amateurs to professionals, deduplicated so no fixture is counted twice. For each metric we asked how often a winning team ranks above a losing one, counting ties as half, which puts measures on different scales on the same footing. Running the ranking again on each half of the cohort returned the same order, which is the check that the separation is a property of the rugby rather than of the sample. Two set-piece measures were dropped rather than reported: close to half of teams win every one of their own scrums in a match, so splitting into quarters puts a whole quarter inside one tie and returns nothing meaningful. Where a metric could be built from both sides we used the team’s share rather than its raw count, because a raw count rises with time in possession and quietly measures that instead. One honest caveat, running in a single direction: these teams were analysed because somebody chose to, and they win a little more than half their matches, so read every band as a comparison between analysed teams. Scores are reconstructed from the scoring events we recorded, which holds across thousands of matches but not for any single scoreline.
Hero photo: Peter Clarke, CC BY-SA 3.0, via Wikimedia Commons.