Team sheets get written from the top. The fifteen are chosen, argued over and read out first, and then somebody fills in the rest. We wanted to know what the rest are actually worth, so we took every recorded involvement belonging to jerseys 16 to 23 across thousands of fully analysed matches spanning every variety of rugby, men’s and women’s, from amateurs to professionals. Two things came out. One is a fair share. The other quietly undermines the word “bench”.
They do about a seventh of everything
Across carries, tackles, breakdown work, passes and errors, the last eight jerseys account for roughly a seventh of a team’s total recorded involvement. Their share is highest in the unglamorous work, arrivals at the breakdown and tackling, and lowest in passing, which is what you would expect from replacements who arrive with the game already stretched and the ball moving less.
On the scoreboard they take about one try in eight. That is a little below their share of the work, but not dramatically, and it is many more tries than most coaches would guess if you asked them to estimate before looking.
They are not noticeably worse than the players they replace
The obvious worry about replacements is that standards drop. In our data they do not, at least not measurably. The last eight jerseys concede penalties and cough up the ball at close to the same rate per involvement as the starters. Whatever the drop-off at professional level, we cannot see one here. Given how much of the closing quarter runs through these players, that is a more reassuring finding than it first appears.
The awkward part: your bench is not really a bench
Now the finding that changes how you read all of the above. We checked when the first player wearing 16 to 23 shows up in each match, expecting a cluster in the second half. Instead, in nearly half of all matches a bench jersey is involved inside the opening tenth of the game. The typical first appearance lands early in the first half, not after the break, and only about one match in five sees the last eight held back until the hour approaches.
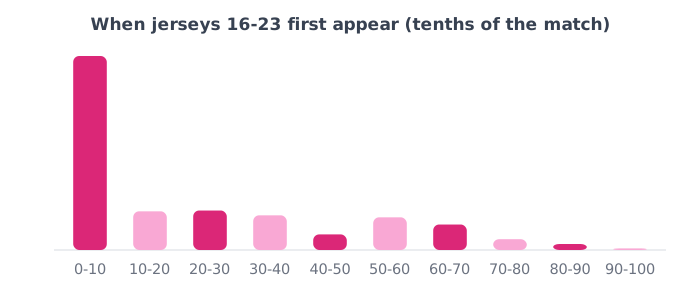
Some of that is rolling substitution, which is normal in schools and age-grade rugby and changes the shape of a squad entirely. Some of it is that clubs number their players however they like, so a 16 or a 20 is sometimes just a starter with a high number. Either way, the professional model, fifteen starters and eight impact players held for the final quarter, describes a minority of the rugby we see.
What to do with this
Pick your last eight as players, not as insurance. They are going to do a seventh of your work, score a meaningful share of your tries, and in most matches be on the pitch long before the moment you imagined using them. That has three consequences worth acting on. Prepare them properly, because they will not get a gentle twenty-minute cameo. Give them real roles in your attacking shape rather than assuming they slot into someone else’s. And when you review the game, review their footage too, since a seventh of everything you did is theirs.
If you are curious where the tries actually go, we have looked at which position scores the most, and the anatomy of an average match sets out the total volume these shares divide up.
How we worked this out
Based on every recorded involvement attributed to a jersey number across thousands of fully analysed matches spanning every variety of rugby, men’s and women’s, from amateurs to professionals, deduplicated so no fixture is counted twice. Jerseys 1 to 15 are treated as starters and 16 to 23 as replacements, which is the convention rather than a guarantee: as the timing section above shows, plenty of squads do not use numbers that way, and that is part of the finding rather than a flaw in it. Shares are of involvements we record for the team being analysed, the side of the game our data captures most completely, so they describe that team’s own distribution of work. Try shares cover tries where the scorer’s jersey was identified. Timing uses each match’s own span of recorded play, restricted to matches long enough to be a full game, so a first appearance is measured against the match it belongs to rather than a fixed clock.
Hero photo: Patrick Gillett, CC BY-SA 3.0, via Wikimedia Commons.