Which position misses the most tackles depends on whether you count the misses or the share of attempts missed. We collected every made and missed tackle by the shirt number of the defender, across thousands of matches from every variety of rugby, men’s and women’s, from amateurs to professionals. The inside centre misses the most, about two tackles a match, while the wings, the full-back and the half-backs miss about one attempt in three.
The 12 misses about two tackles a match
Counted per match, the inside centre misses more tackles than any other shirt, about two a match. The fly-half, the outside centre and the openside follow, each missing nearly two. The props and the full-back miss the fewest, a little over one each.
Part of that order is volume. The 7 makes more tackles than any other shirt, and the 12 attempts about as many as the 6 or the 8, so both have more chances to miss. A 12 attempts about seven tackles in a typical match and misses two of them.
The back three and half-backs miss one attempt in three
Per attempt, the order changes. The wings, the full-back, the fly-half and the scrum-half each miss about one tackle in three they attempt. The centres miss about three in ten. The front row misses about one in four, and the locks and the back row a little over one in five, the lowest of any shirts.
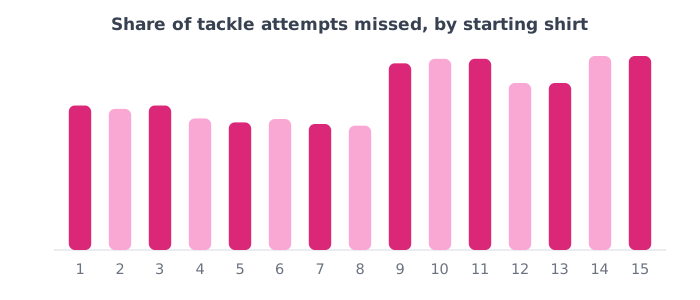
The split follows where each player tackles. A forward mostly tackles near the ruck, against a carrier with a few metres of run-up and team-mates on either shoulder. A back tackles in wider space, often against a carrier with room to step, and a wing or full-back is often the last defender, with nobody inside to finish the job if the first contact slips.
The full-back misses few tackles but a third of attempts
The full-back shows why one number is not enough. By count, the 15 misses about as few tackles as the props. By rate, the 15 misses about one attempt in three, among the highest of any shirt. The full-back makes fewer tackles than anyone, and many of them are one-on-one in open field.
The 12 is the opposite case. Their miss rate is the lowest of the backs, level with the 13, but they tackle so often that they still miss more than anyone. A coach who looks only at the count will worry about the 12, and one who looks only at the rate will worry about the back three.
What to do with this
Judge every defender on both numbers. Two misses from seven attempts is a typical match for a 12, and one miss from three attempts is a typical match for a full-back. Hold each player against the normal range for their shirt before you call a miss rate a problem.
Then aim the work. For the back three and the half-backs it is tackling in space: the angle of approach, shortening the steps before contact and getting square. For the 12, the 10 and the 13 it is volume, so their technique needs to hold up late in a match, when the most traffic has already come down their channel. For the team-wide figure, see what a good tackle completion rate looks like.
How we worked this out
Based on over 300,000 tackle attempts across over 4,000 fully analysed full-length matches spanning every variety of rugby, men’s and women’s, from amateurs to professionals, deduplicated so no fixture is counted twice. Each made or missed tackle is recorded against the shirt number of the defender, and we used the shirt as a stand-in for position, which is fair where teams number their starting fifteen in the usual way. Misses per match divide each shirt’s missed tackles by the number of matches, and the miss rate divides missed tackles by made plus missed. Assists, replacements and tackles where the number could not be read are left out. To check the order is real rather than noise, we split the matches at random into two halves: the 12 missed the most in both, and the same five backs had the highest miss rates in both. These are per match for the shirt, not per minute played. Tackle detail is recorded for the team being analysed, the side of the game our data captures most completely.
Hero photo: Diego Molero, CC BY 2.0, via Wikimedia Commons.