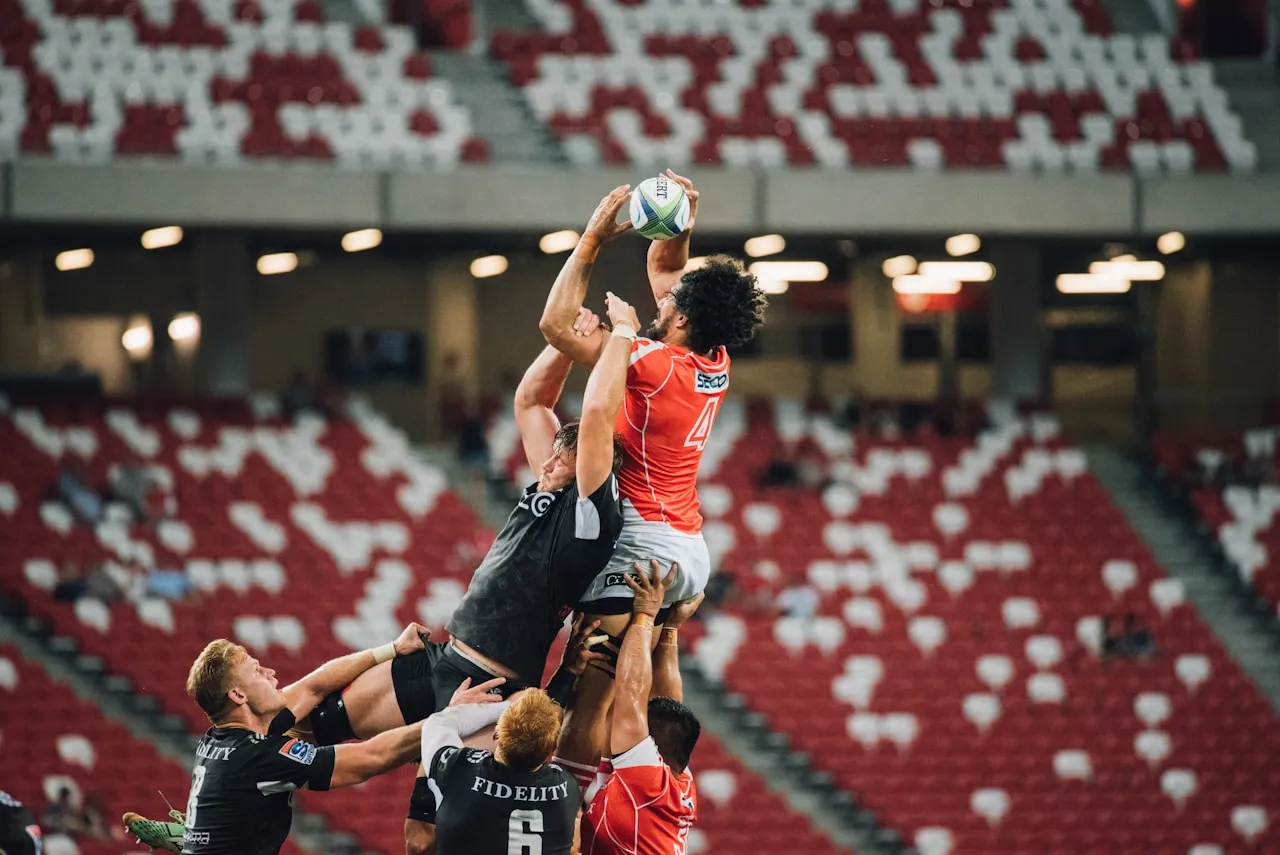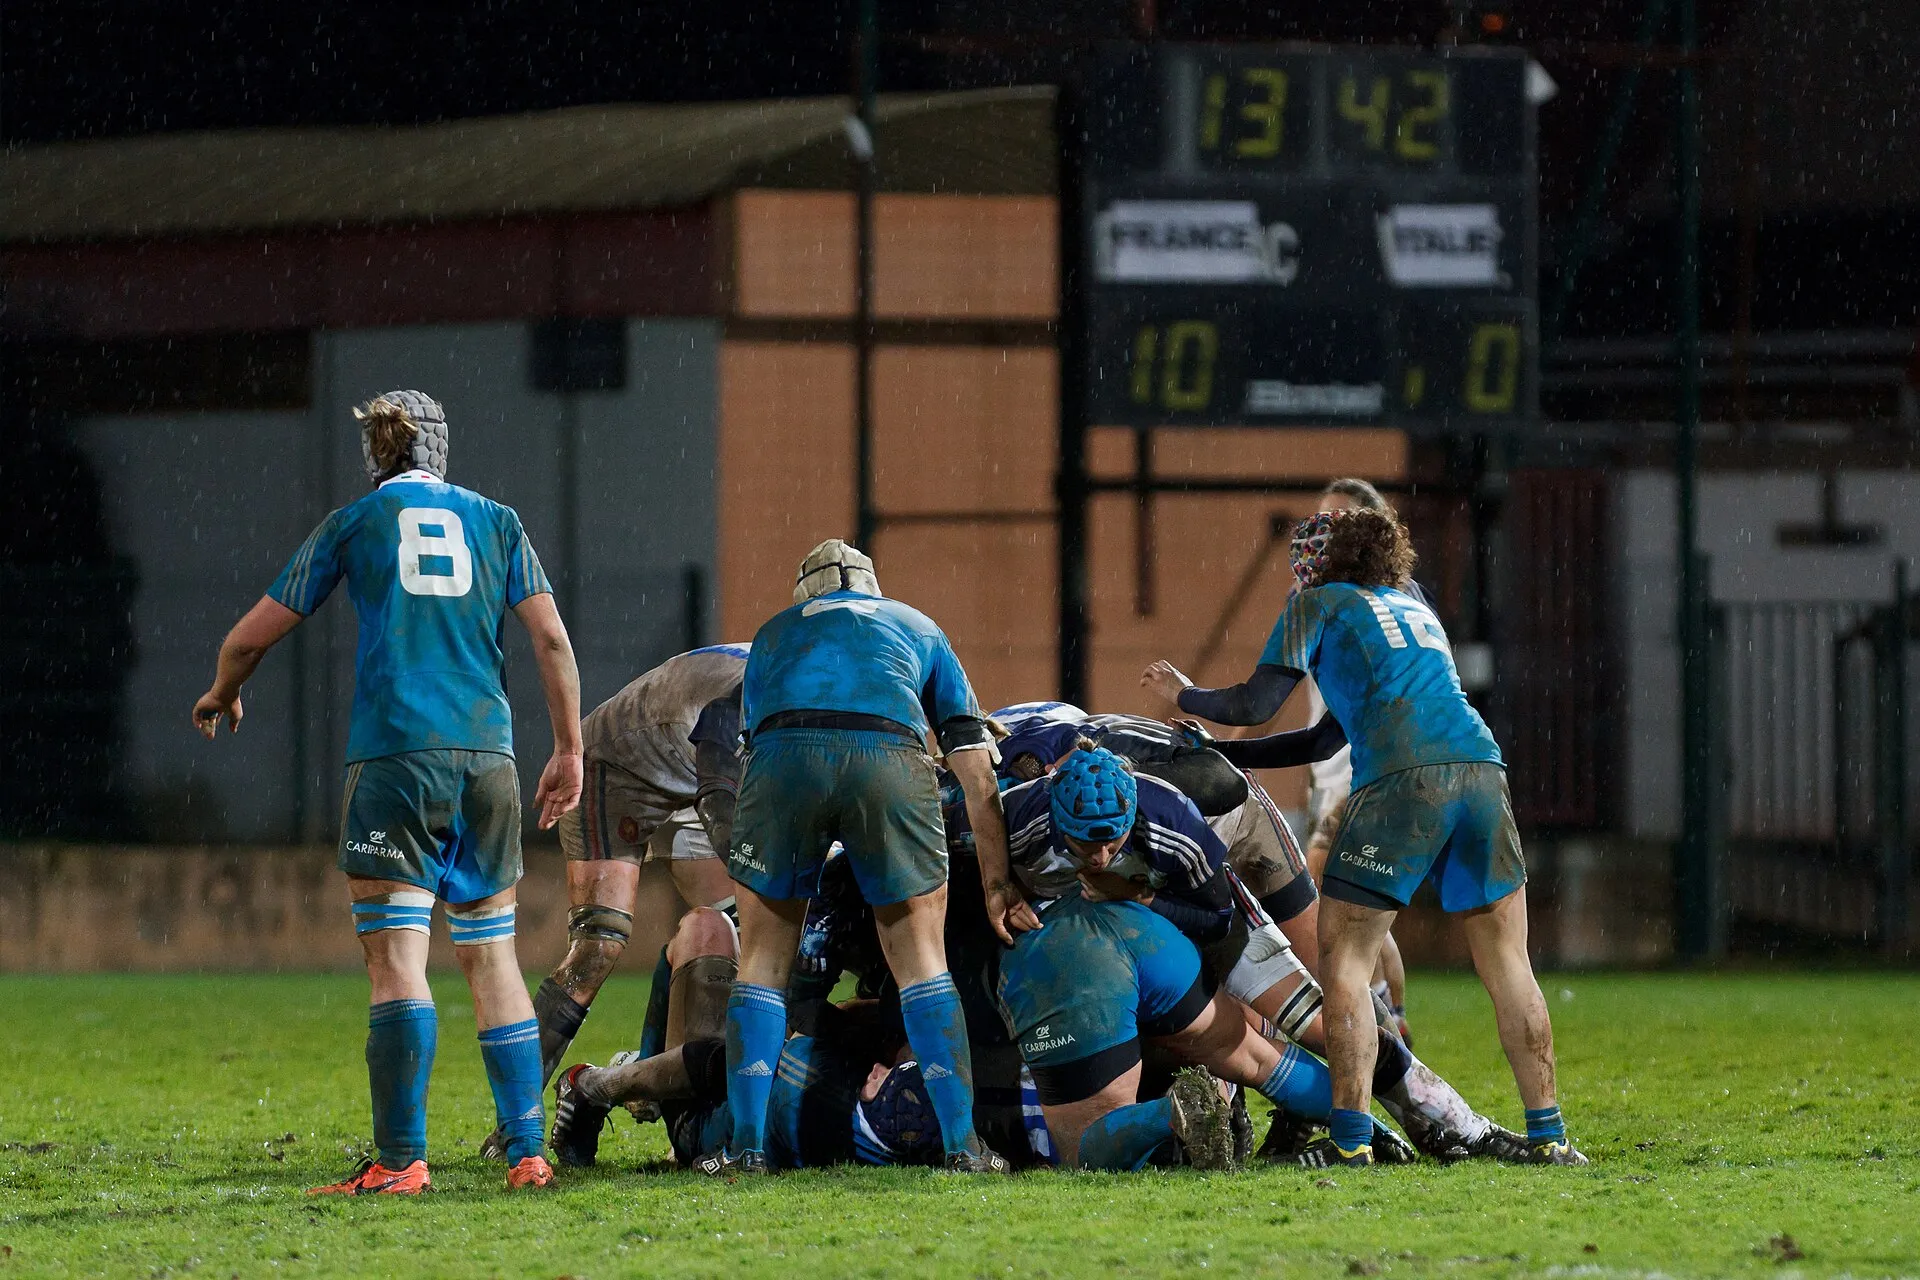
The locks and the back row hit the most rucks in rugby: the five shirts from four to eight do about half of a team’s arrivals between them, the pack as a whole nearly three in four, and the scrum-half the fewest of any starter. Every try gets a name attached. Nobody records who hit the fourteen rucks that made it possible - except that we do, arrival by arrival, shirt by shirt. Arriving at a ruck is the most common piece of individual work in our data, close to half a million arrivals collected across every variety of rugby, men’s and women’s, from amateurs to professionals. Counted by jersey, it is the clearest picture we have of who does rugby’s unpaid labour. The pack does very nearly three arrivals in four, and the shirts that clear the most score the least.
The engine room means it literally
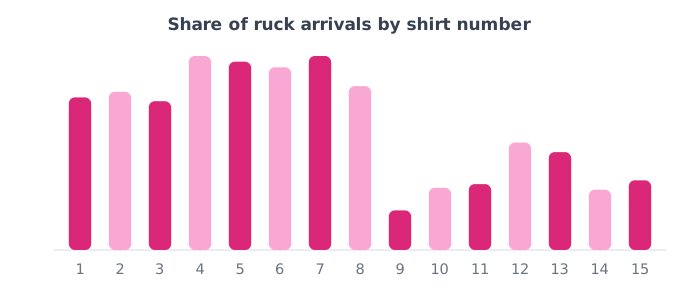
Share out the arrivals across the fifteen starting shirts and the pack’s dominance is total: the forwards account for very nearly three arrivals in four. The heaviest lifters are exactly who folklore says they are - the second row and the back row each put in about one arrival in ten, so the five shirts from four to eight do roughly half the team’s clearing out between them. The front row adds about another quarter. No back gets close: the busiest backs at the breakdown are the centres, and even they do about half the work of a lock.
The scrum-half touches everything and clears almost nothing
The lowest bar on the whole chart belongs to the nine. About one arrival in fifty is the scrum-half’s - the fewest of any starting shirt, from the player who is standing next to more rucks than anyone on the pitch. That is not laziness, it is the job description: the nine’s work starts the moment an arrival ends, and a scrum-half buried in a ruck is a team with nobody to play the ball away. If your nine is topping your arrival counts, something upstream has gone wrong.
Clearing rucks and scoring tries are opposite jobs
Put the arrival shares next to the try shares and the trade is stark. A lock puts in roughly three times the wing’s breakdown work; the wing scores nearly three times the lock’s tries. The one glorious exception is the hooker, who outscores both locks - the driven lineout pays its wages in tries. Winning the breakdown is worth real wins, and this is who actually pays for it: the shirts at the bottom of every highlight reel and the top of this chart. The try-scoring end of the bargain has its own post.
What to do with this
Make the invisible work visible on your own terms. If your match review only ever names carriers and finishers, your praise economy is paying the wrong people - read out the arrival counts, and watch what it does to a second row’s season. Use the nine’s number as a health check rather than a target. And if nobody at your club is counting any of this, that is the real gap between watching footage and having analysis: it is exactly the question to settle before spending money on either.
How we worked this out
Based on getting on for half a million ruck arrivals recorded across thousands of fully analysed matches spanning every variety of rugby, men’s and women’s, from amateurs to professionals, deduplicated so no fixture is counted twice. Arrivals are recorded shirt by shirt for the analysed team, and we counted each starting jersey’s share of the team’s arrivals; arrivals where the shirt could not be read are excluded, as are jerseys above fifteen - about a sixth of the total - because replacement shirts do not map reliably onto positions at amateur level. The check that the split is real is its internal consistency: the same shirts sit at the top of the arrival counts and the bottom of the try shares across the whole cohort, and the try pattern independently matches our position-scoring analysis. One honest caveat: the shirt is a strong but imperfect proxy for the role, since clubs occasionally number squads their own way. Figures reflect the analysed team’s events, the side of the game our data captures most completely.
Hero photo: Pierre-Selim Huard, CC BY 3.0, via Wikimedia Commons.