Rugby talks about contact as a battle. Two players meet, one goes forward, one goes backward, and the crowd decides who won. We have that argument settled in the data. Every carry and every tackle we record carries a verdict on the collision itself: did the carrier get over the gain line, or did the tackler stop them going anywhere? We collected hundreds of thousands of carries and hundreds of thousands of tackles, from every variety of rugby, men’s and women’s, from amateurs to professionals. The verdict is far more lopsided than the commentary suggests.
The carrier wins nearly nine collisions in ten
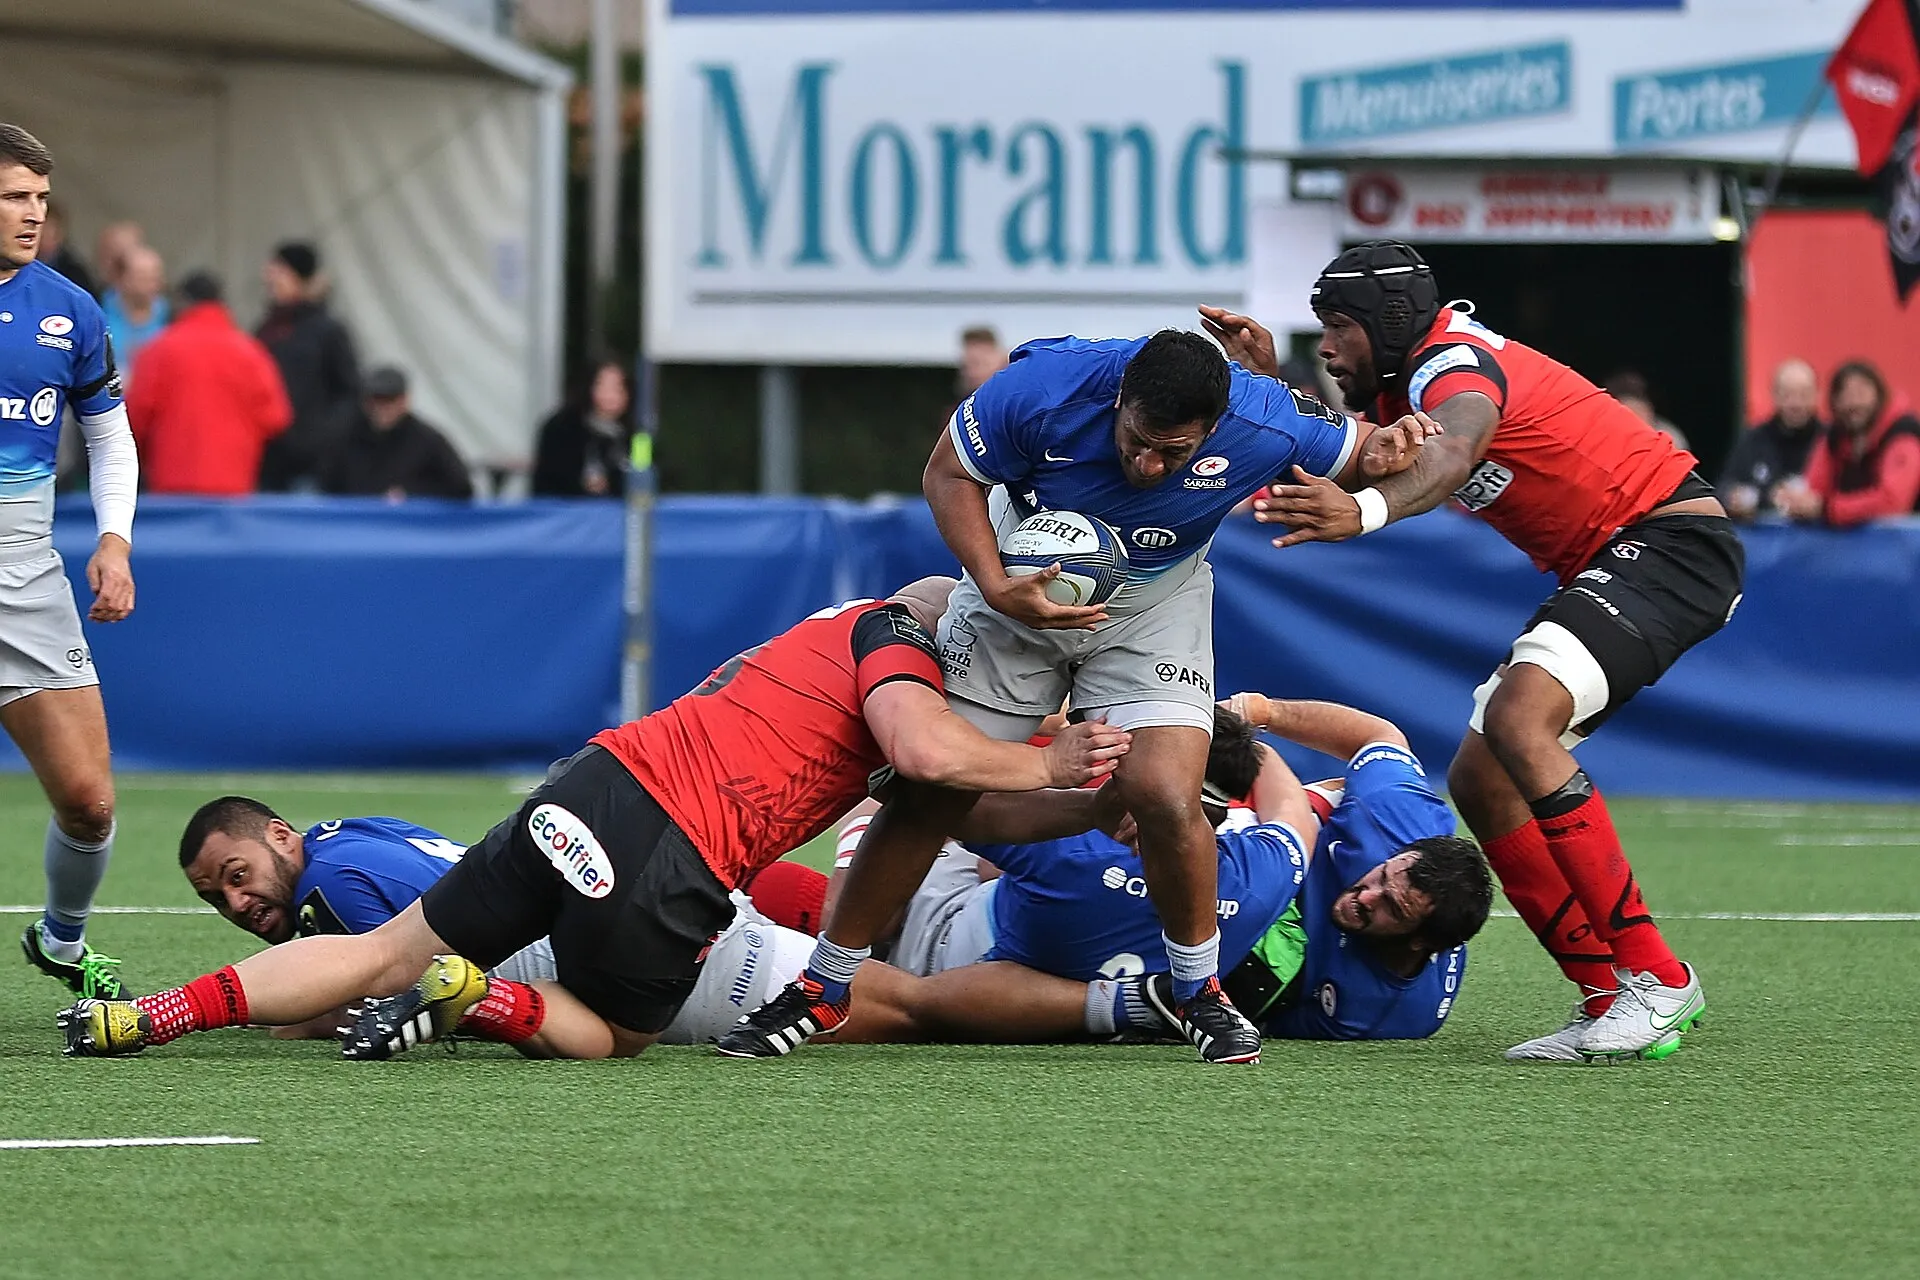
Take every carry in the data and ask who won the contact. The ball carrier comes out on top getting on for nine times in ten. Look at it from the other side, through the tackles instead of the carries, and you get the same answer in reverse: the tackler wins the collision in only about one made tackle in ten.
That is worth sitting with, because it inverts how defence is usually described. A dominant hit is not the normal outcome of a tackle. It is the rare one. The everyday tackle does something much less glamorous: it stops the player without stopping the momentum, the ball goes to ground, and the game moves on.
Two separate records that agree with each other
We record carries and tackles as different events, tagged independently. They do not have to agree, and the fact that they do is the strongest quality check we have. The share of collisions the carrier wins and the share the tackler loses land within a point and a half of each other, from two streams that never look at one another. When independent measurements of the same moment converge like that, you can lean on the number.
Dominance is rare, and that is exactly why it matters
If nine in ten collisions go the carrier’s way, the tenth is where the difference lives. So we sorted matches by how often the carrying team won its contacts and looked at who won the game. The gradient is one of the steepest we have found. Teams in the bottom quarter for winning collisions win around two matches in five. Teams in the top quarter win closer to two in three. Between those two lines sits a smooth, orderly climb, with no flat stretch and no reversal.
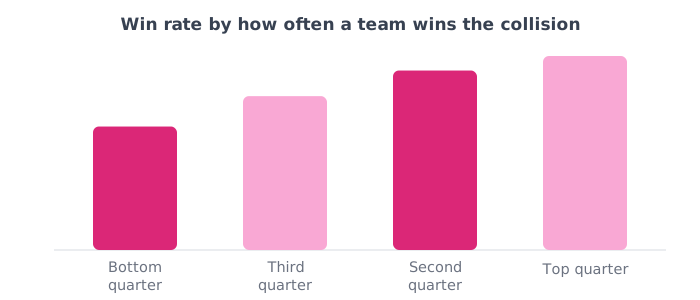
The shape matters as much as the size. Plenty of rugby statistics separate the very good from the very bad and say nothing in between. This one distinguishes at every level, which means it is measuring something real about how a team plays rather than simply detecting the better side.
What to do with this
Stop coaching the dominant hit as the standard and start coaching it as the edge. Most of your defenders will spend most of Saturday making tackles that do not win the collision, and that is normal, not a failure. What separates teams is how often they get the extra one: the low, square, driving tackle that puts the carrier backwards.
On the other side of the ball, the same numbers say something reassuring. Your carriers are already winning most of their contacts. The gain is not in carrying harder, it is in carrying less often into the tackles you were always going to lose. And the two things you can actually measure week to week are close by: how many of your tackles stick at all, and what happens at the breakdown afterwards. For the volume context, an average match contains about sixty carries and ninety tackle attempts per team.
How we worked this out
Based on hundreds of thousands of carries and tackles recorded across thousands of fully analysed matches spanning every variety of rugby, men’s and women’s, from amateurs to professionals, deduplicated so no fixture is counted twice. Every carry is recorded as won or lost by the carrier, with no neutral option, so a contact that is not clearly won by the tackler counts to the carrier: read the headline as “the tackler rarely dominates” rather than “the carrier always breaks through”. Tackle assists are counted separately and excluded from the collision verdict, and missed tackles are excluded because no collision was won by anyone. The win-rate comparison uses matches with a decided result and enough carries to be meaningful, with the score derived from tries, conversions, penalties and drop goals we recorded. Carry and tackle detail is recorded for the team being analysed, the side of the game our data captures most completely.
Hero photo: Clément Bucco-Lechat, CC BY-SA 3.0, via Wikimedia Commons.