We collect thousands of data points on rugby teams, from every variety of rugby, men’s and women’s, from amateurs to professionals. It is an odd thing to put in writing, then, that some of the most quoted numbers in the sport are the least trustworthy. Not wrong, exactly - measured correctly, reported accurately, and still pointing coaches at the wrong conclusions. Here are four we have tested against results, and what each one turns out to be measuring instead.
Possession reads like control and settles almost nothing
The half-time possession graphic is presented as a verdict. In the matches where we analysed both sides, the team with more of the ball won fewer than three games in five - better than a coin toss, nowhere near a verdict. When possession was close to even, which is most matches, the result was a genuine coin flip. Possession tells you where the ball has been. It does not tell you what either team did with it, and what you do with it is the part that scores.
Momentum is a story told after the fact
Everyone has seen a team “seize the momentum”. We went looking for it: if scoring runs were real, the team that just scored should score next more often than chance predicts. They do score next more often than half the time - but shuffle the same scorelines into random order and the streaks come out just as long. The pattern that feels like momentum is what ordinary sequences of uneven teams look like. The better side keeps scoring because they are better, not because they are hot.
The dominant tackle is the exception, not the standard
Commentary treats the collision as a coin flip that hard teams win. It is not close: the ball carrier wins getting on for nine collisions in ten, and the tackle that puts a carrier backwards is roughly a one-in-ten event. A defender who never dominates the contact is not failing - that is what almost every tackle looks like. What separates teams is the rare extra dominant hit, and whether the routine tackles stick at all.
The tackle count rewards the wrong thing
A big tackle count gets read out like a medal. In our matches it is closer to a warning light: the teams that make the most tackles usually lose, because a tackle count is really a meter of how long you went without the ball. Celebrating a huge defensive shift is fine. Building a game plan that produces one every week is not.
What to trust instead
The numbers that hold up in our data share a shape: they measure quality per event, not volume of events. Tackle completion - the share of attempted tackles that stick - climbs cleanly with winning. So does the share of collisions won. Points per visit to the opposition 22 beats possession as a measure of attack, because it prices what a team does with the ball rather than how long they held it. None of these appear on a half-time graphic. All of them beat the four numbers that do.
The practical move is not to adopt all of them at once. Pick one - completion is the easiest to collect and the hardest to argue with - track it every match for a season, and let it replace one of the liars in your team talk. A club that retires the possession graphic and reads out completion instead has upgraded its entire conversation about the game for the price of one habit.
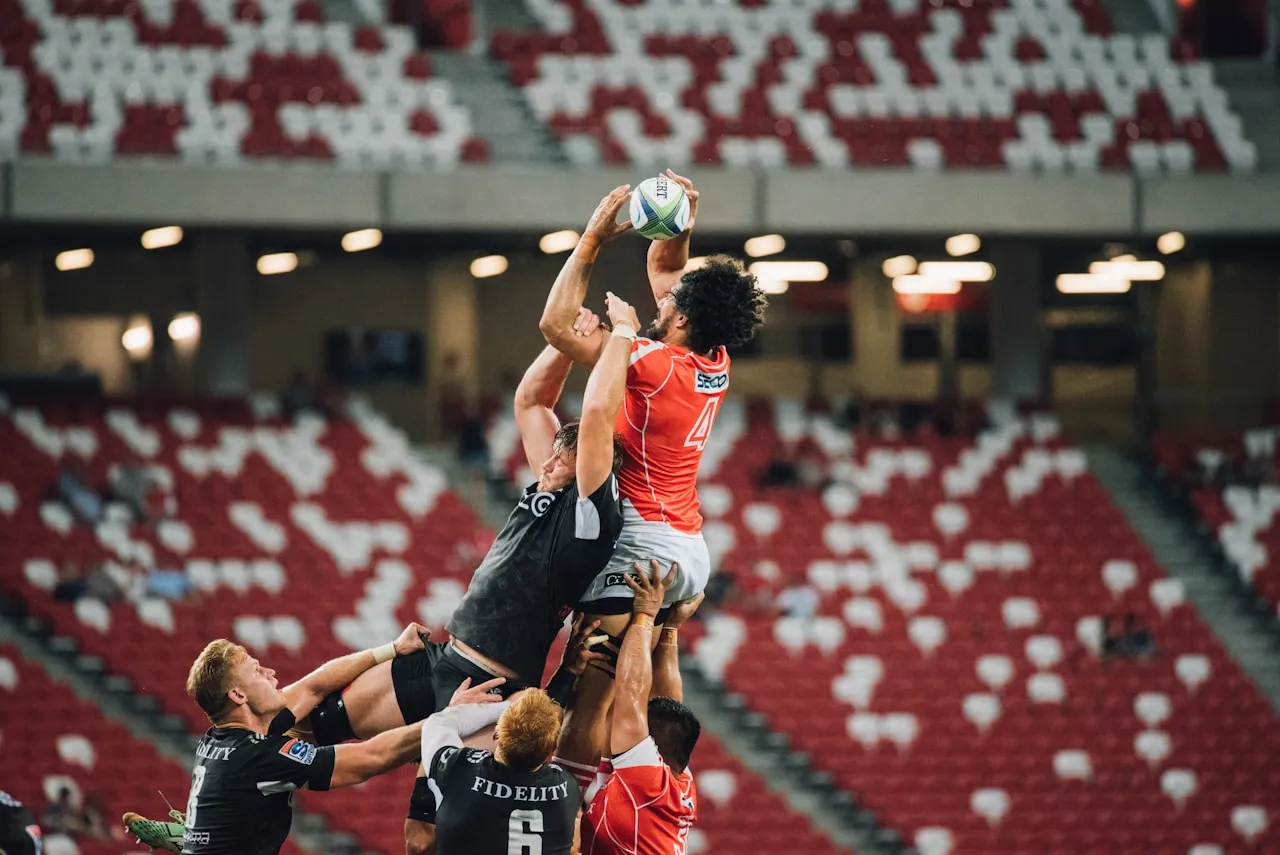
Hero photo: Bearas, CC BY-SA 4.0, via Wikimedia Commons.